Hello Friends, In this article I will explain how to create a SSRS (SQL Server Reporting Services) report in Visual Studio 2019 using SQL Stored Procedure object. The most purpose of this article to reduce the extra effort of the SQL developer during various types of report extraction.
-
- How to create a data source in a SSRS report.
- How to create a dataset in a SSRS report.
- How to use a Stored Procedure in a SSRS report.
- How to use a Graph & table control in SSRS design and tie the dataset to this table.
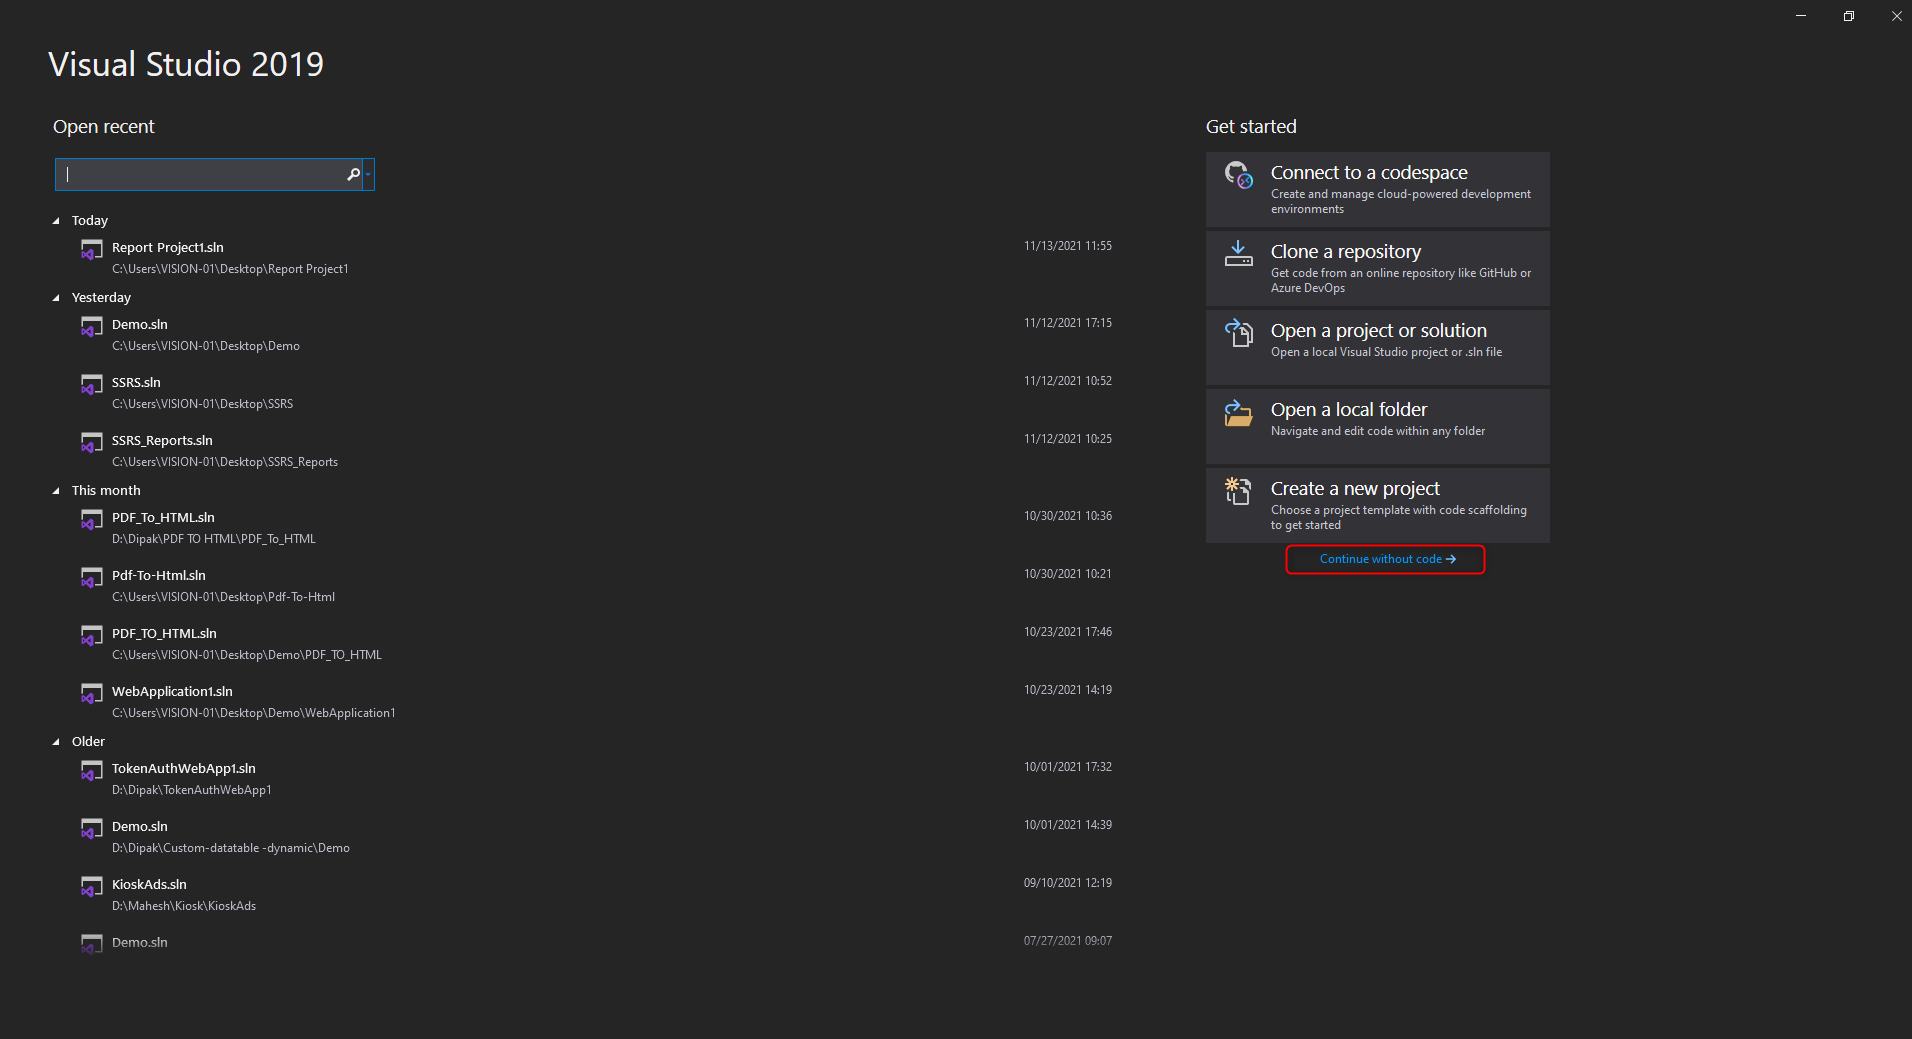
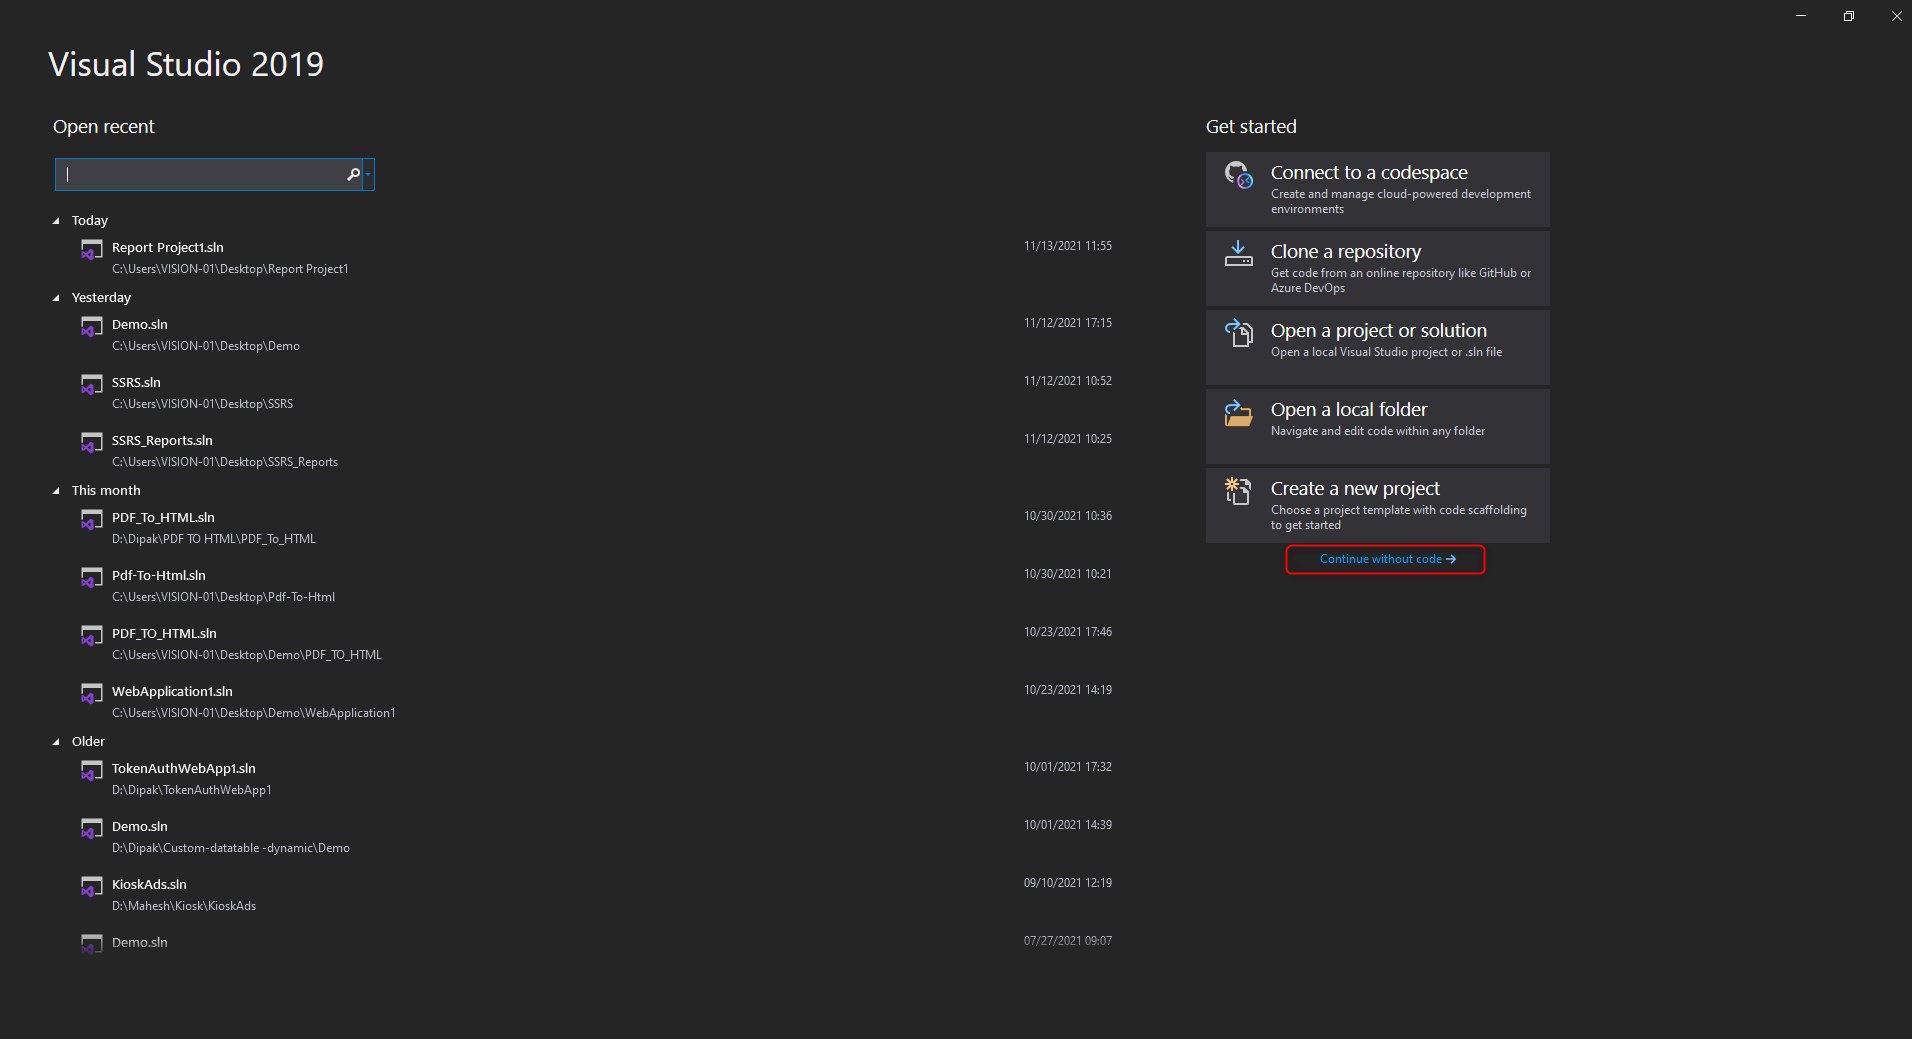
Step 1:- Open Visual Studio & Select Continue Without Code.
Step 2:- Select Extension => Manage Extension.

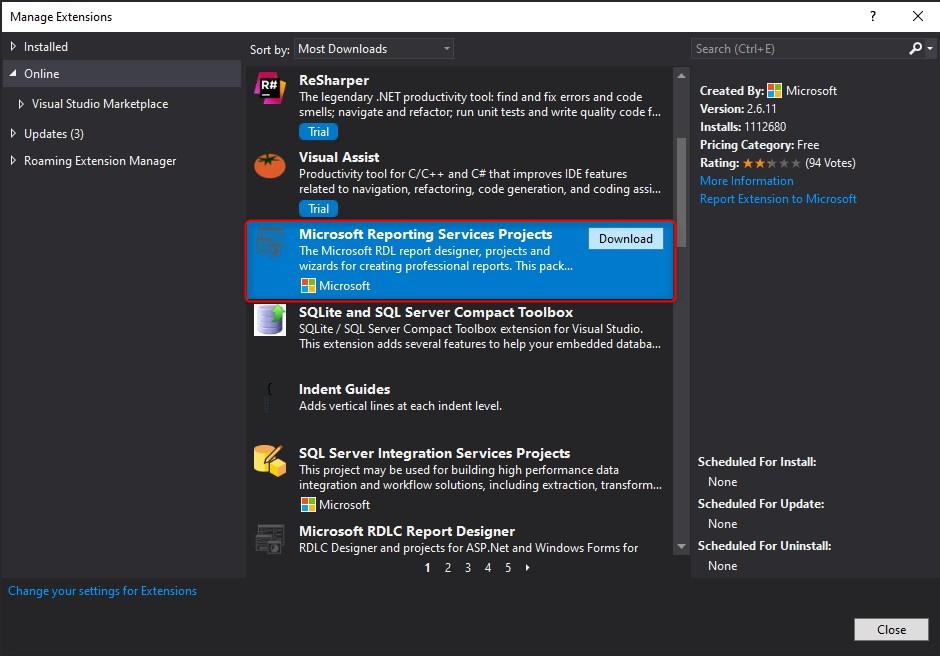
Step 3:- Download Microsoft Reporting Services Projects.
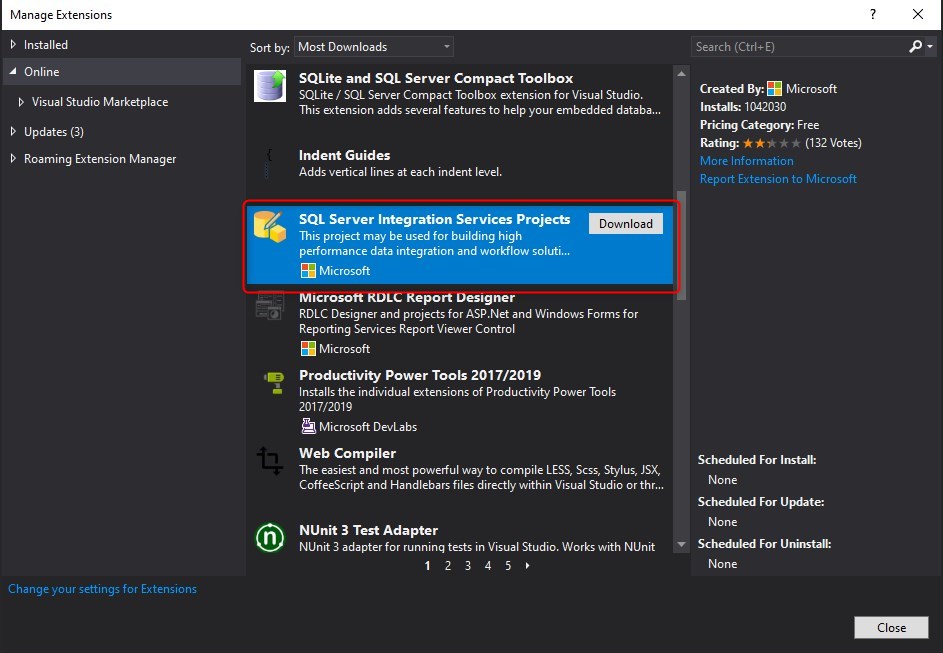
Step 4:- Download SQL Server Integration Services Projects.
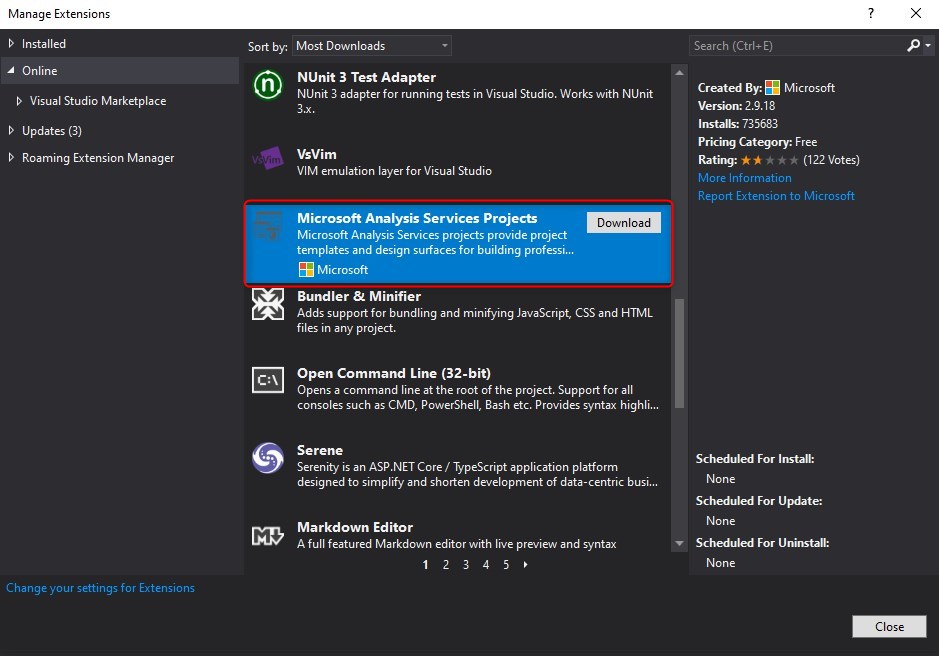
Step 5:- Download Microsoft Analysis Services Projects.
Step 6:- After Download all packages Close the Visual Studio.
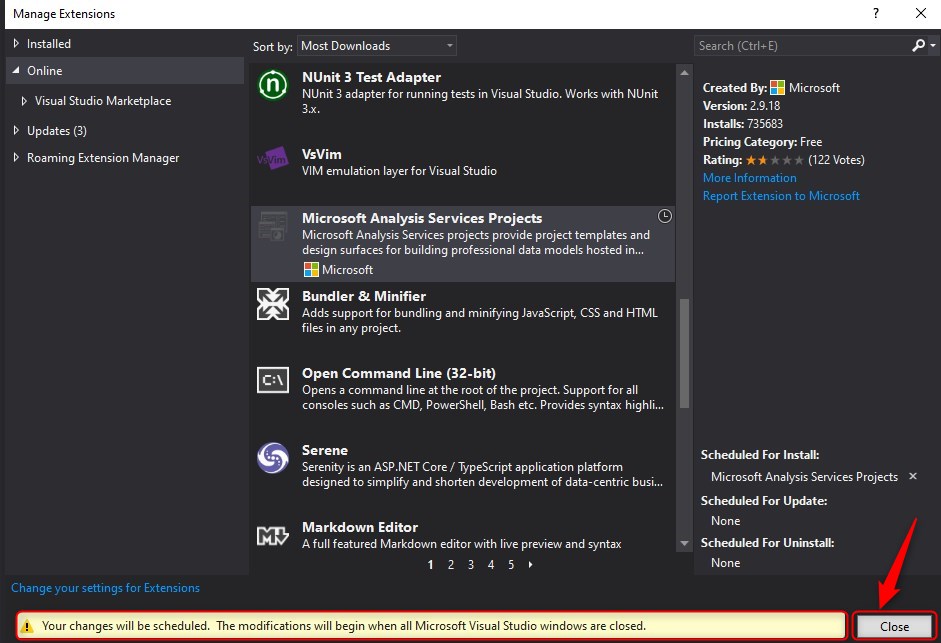
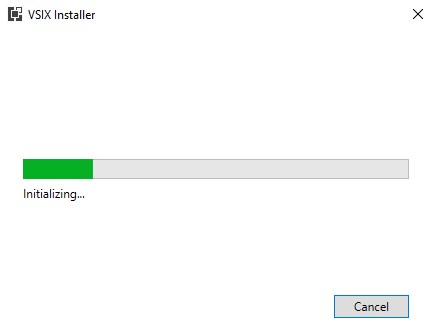
Step 7:- After Close the Visual Studio VSIX Installer Installed Packages.
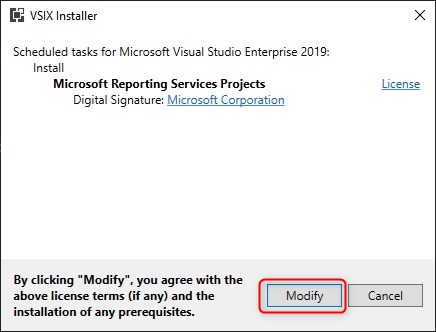
Step 8:- After Installation is done then click on Modify button.
Step 9:- Re-Open Visual Studio and select Continue Without Code.
Step 10:- Go to the New => Project.

Step 11:- Select Report Server Project & Click on Next button.

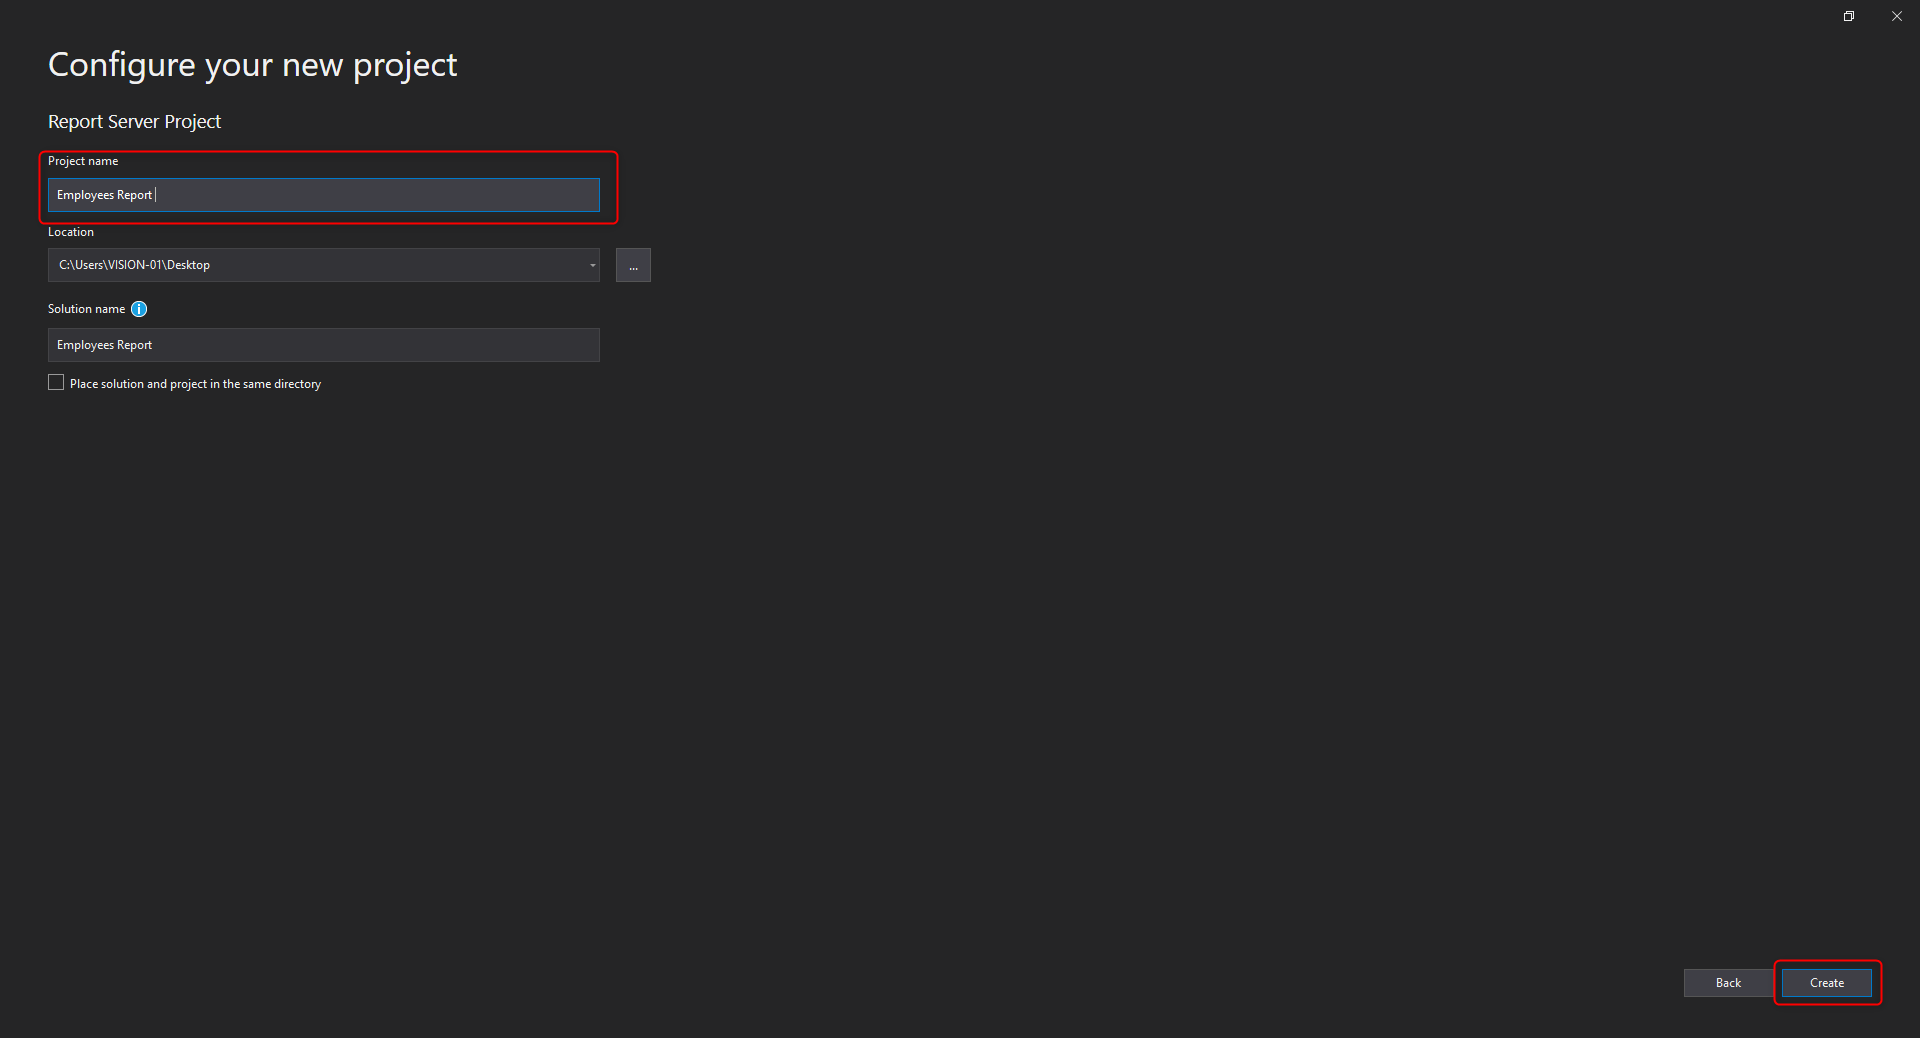
Step 12:- Change or Edit Project Name if you want & Click on Create button.
Step 13:- After creating project open Solution Explorer & right click on Report and Add New Report.

Step 14:-Select Report & give report name and click on Add button.

Step 15:- Open Report Data and click on Data Sources & Add Data Source.
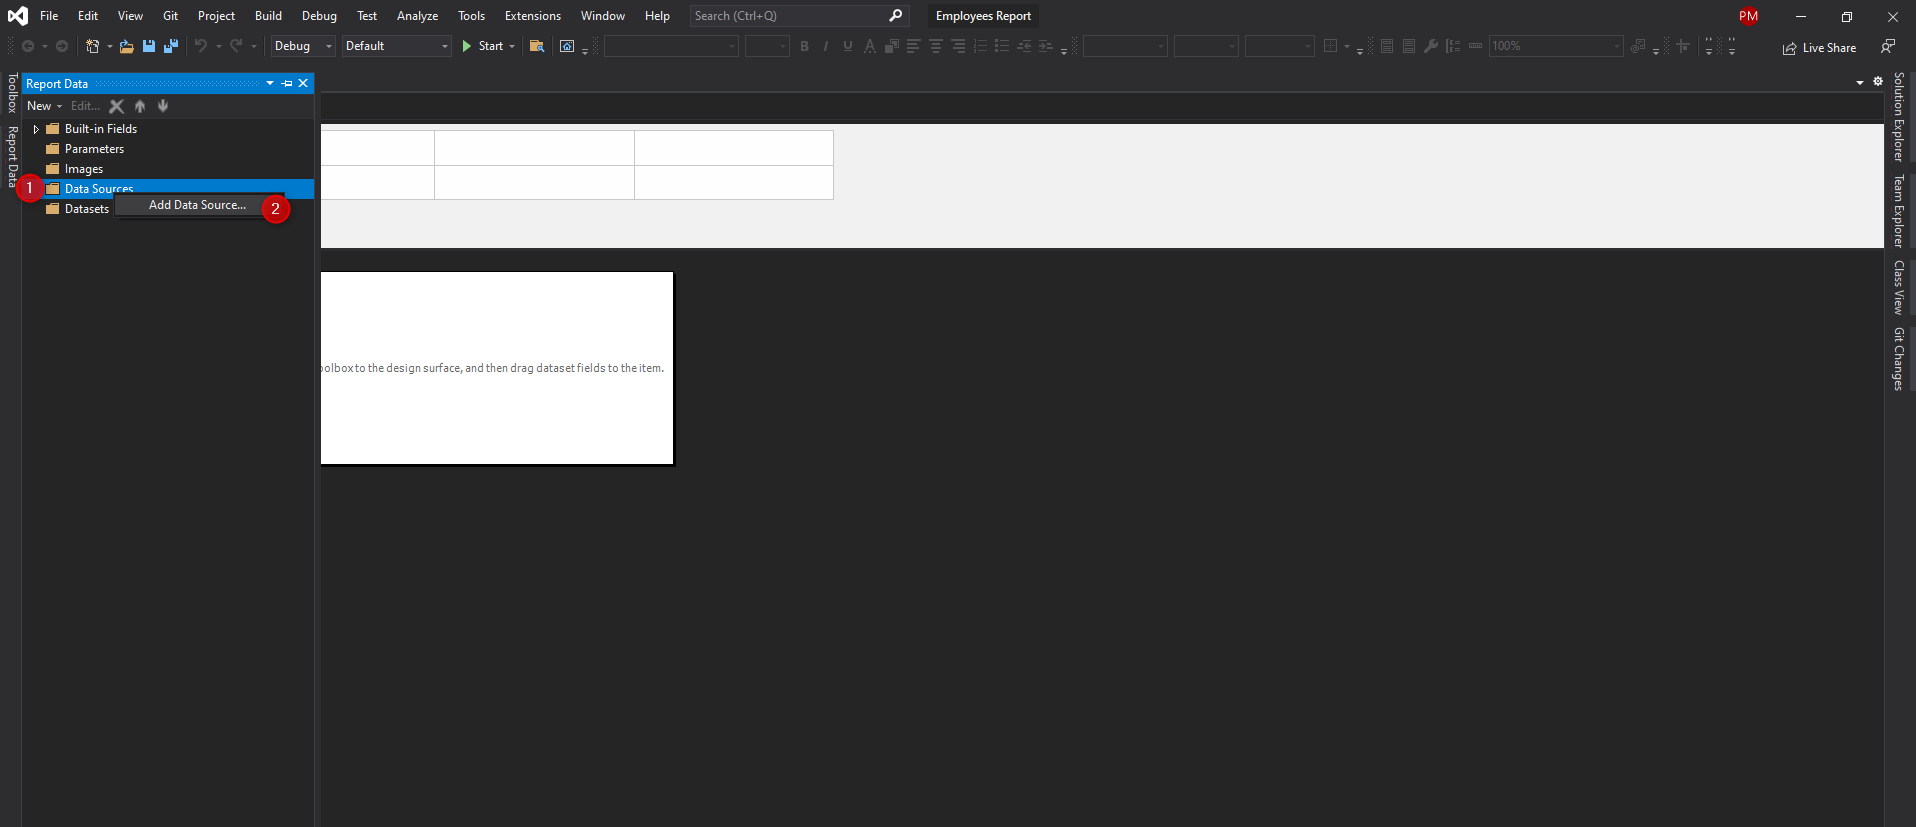
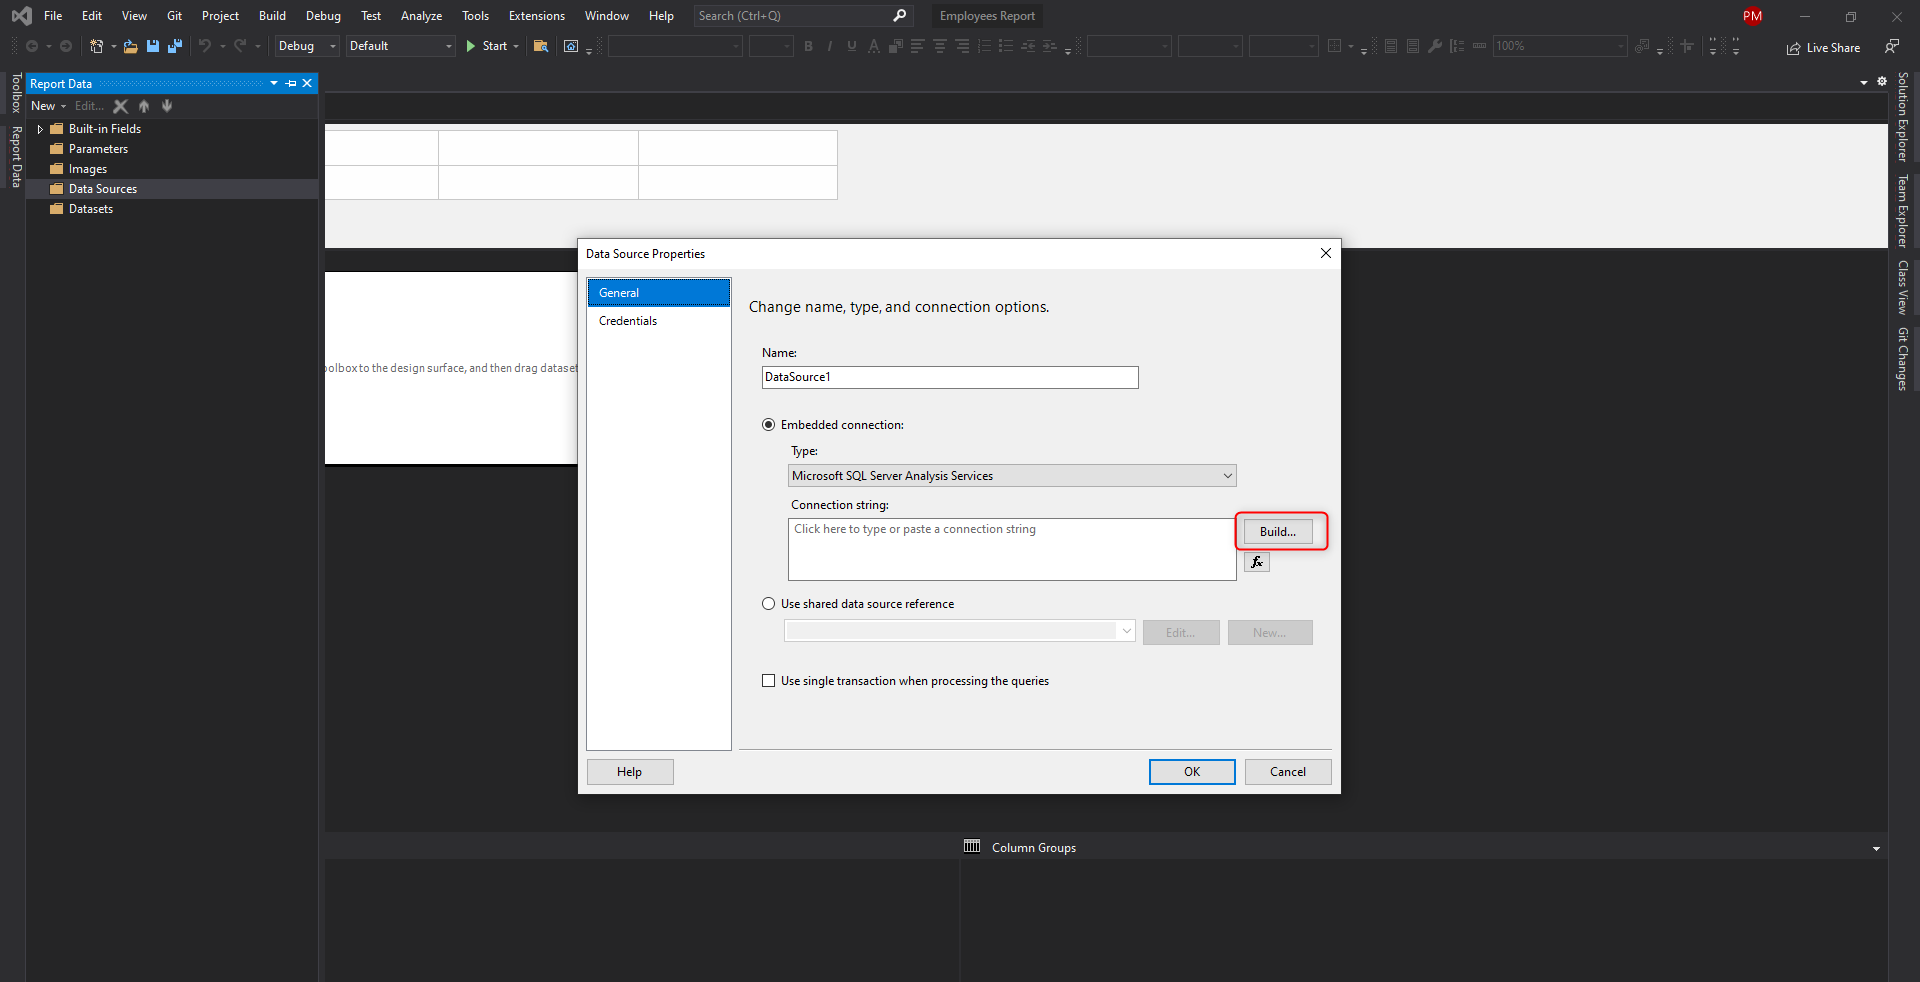
Step 16:- After open Data Sources click on Build button.
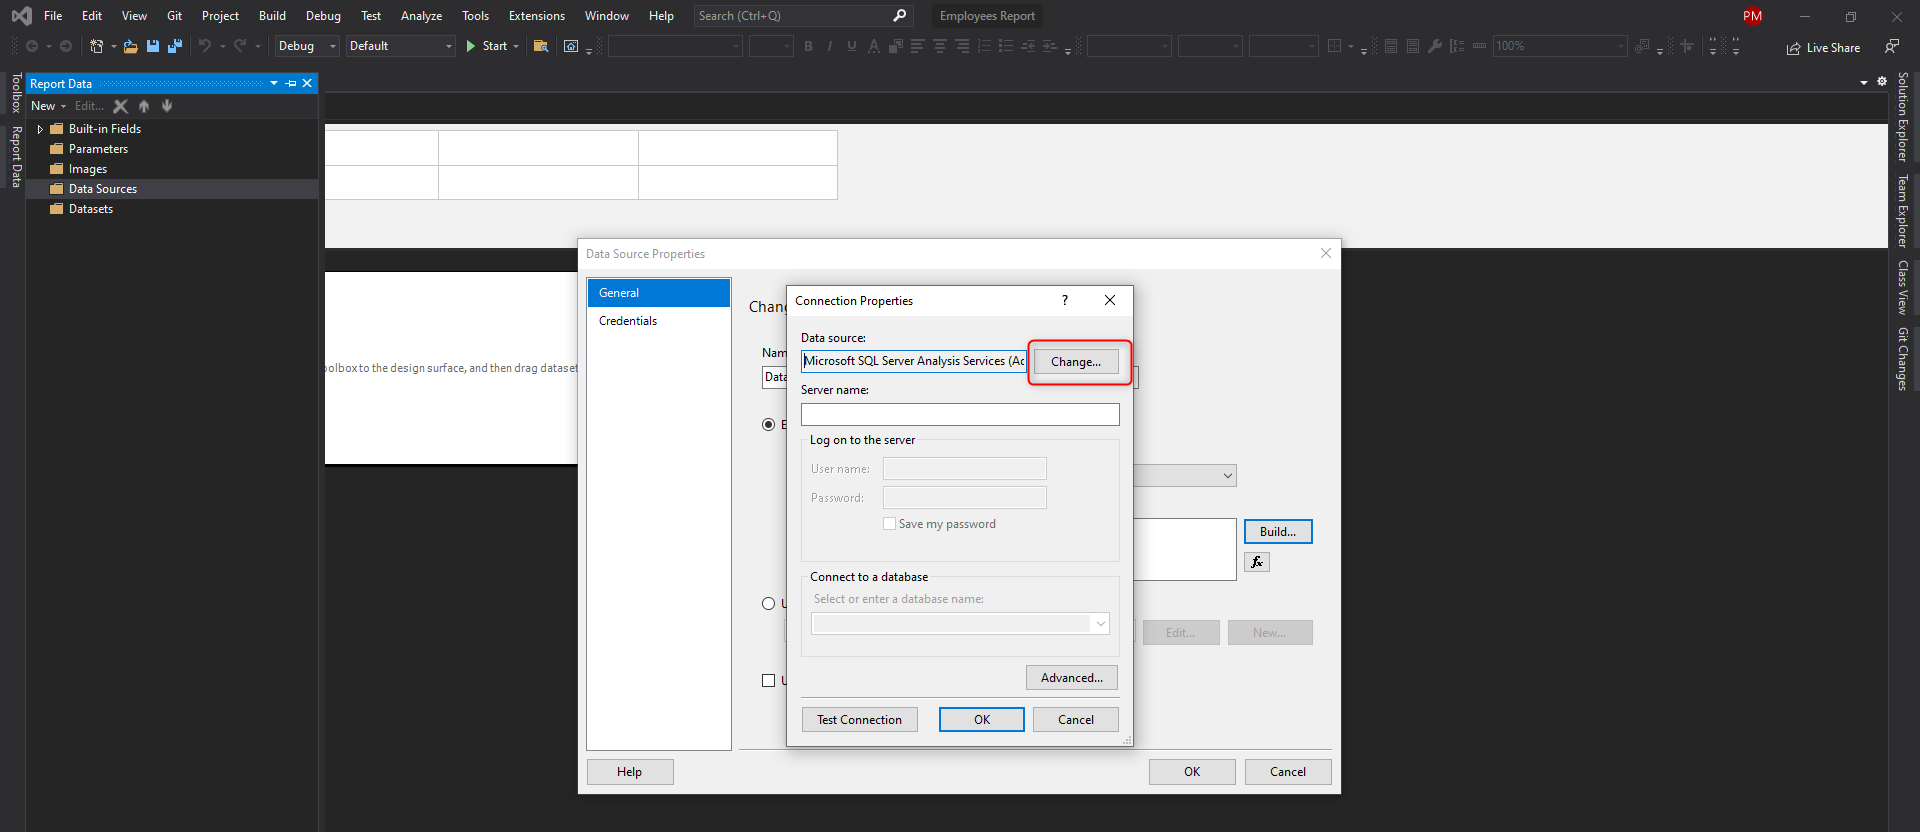
Step 17:- Click on Change Button & Select Microsoft SQL Server.
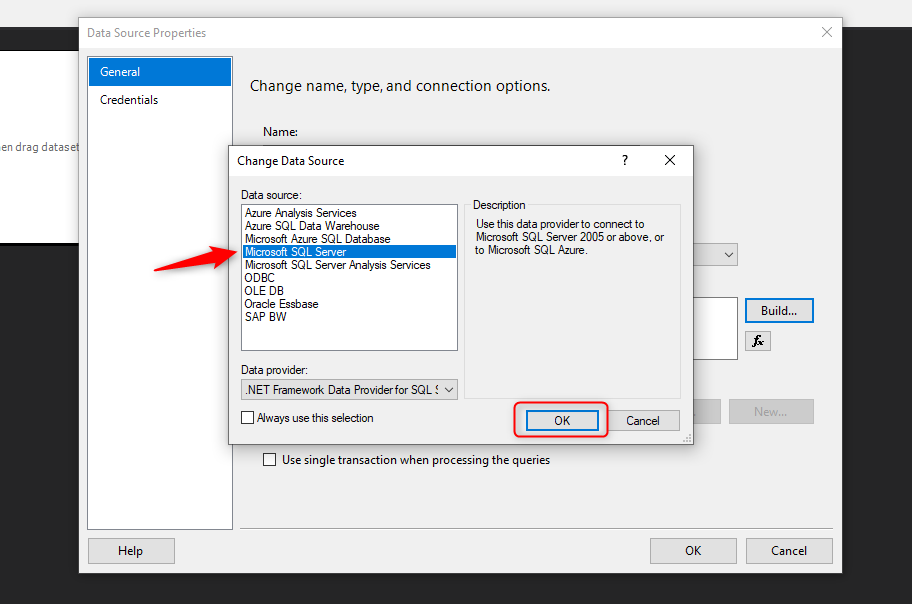
Step 18:- Select Server Name.
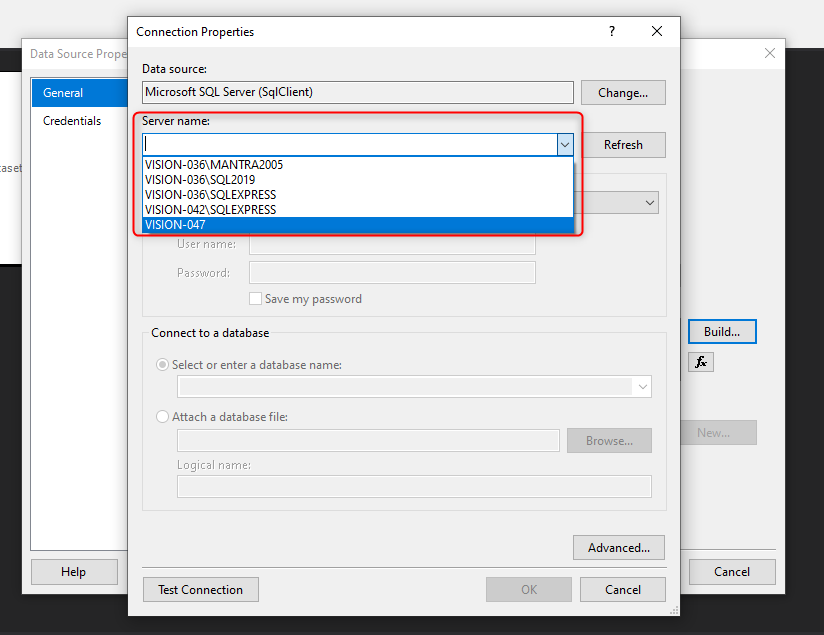
Step 19:- Select Authentication.
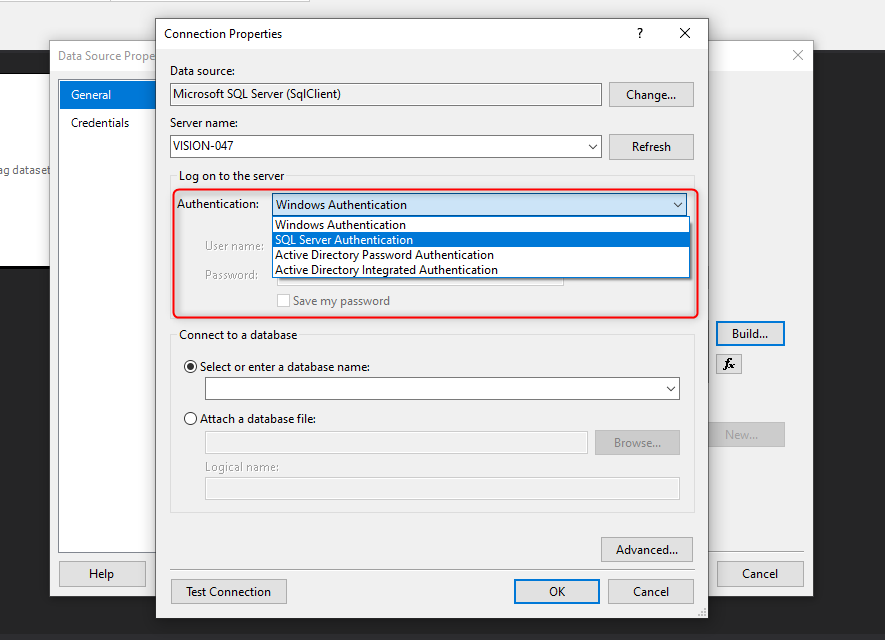
Step 20:- Enter Credential User Name & Password and also select Database Name.
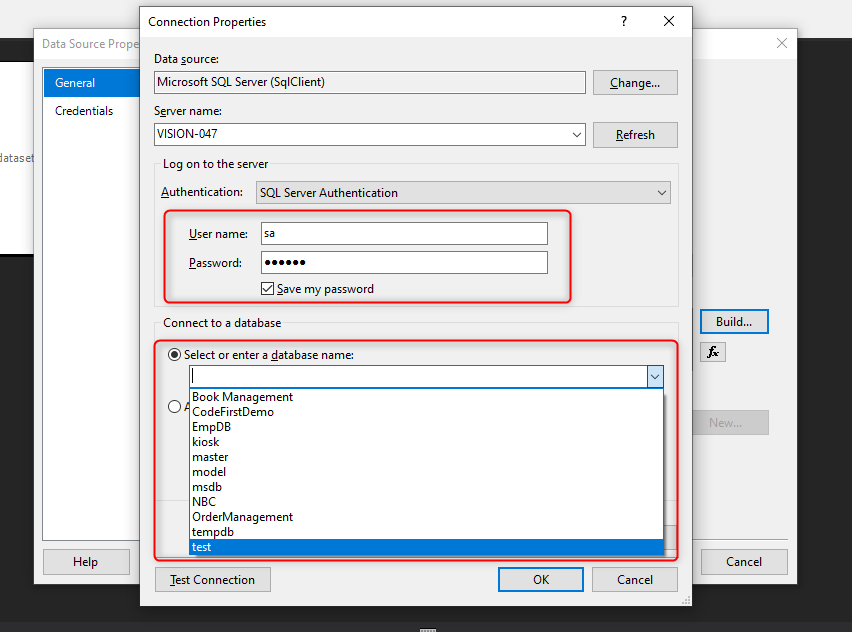
Step 21:- After Enter Credential and select Database Name then click on Test Connection If Test Connection Succeeded then click on Ok button.
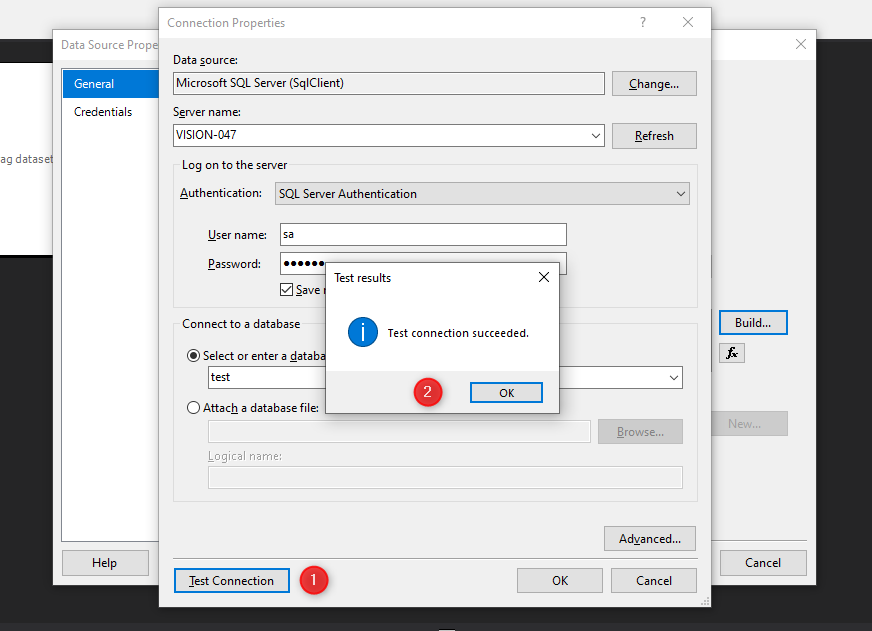
Step 22:- After SQL Database Connection is done then click on Ok button.

Step 23:- Here is below SQL Code to create new Employees_Details table & Add or Insert Manually Data in table.
---------------- Create New Table ----------------

Create table Employees_Details
(
  EmployeeId int primary key identity,
  EmployeeName Varchar(200) NULL,
  EmployeeSalary decimal(18,2),
  EmployeeDesignation Varchar(300) NULL
)

---------------- Create New Table ----------------

---------------- Insert Manually Record In Table ----------------

Insert into Employees_Details (EmployeeName,EmployeeSalary,EmployeeDesignation)
values('Pankaj',80000,'CTO'),
('Faisal',60000,'Project Manager'),
('Tabish',45000,'Leanm Leader'),
('Shaizad',18000,'HR'),
('Sagar',30000,'Developer'),
('Varsha',25000,'QA')

---------------- Insert Manually Record In Table ----------------
Step 24:- Create Store Procedure to get Employees Details list.
Create Procedure Get_Employee_Details
AS
  select EmployeeName,EmployeeSalary,EmployeeDesignation from Employees_Details
GO
Step 24:- Open Report Data & right click on Dataset & Add New Dataset.
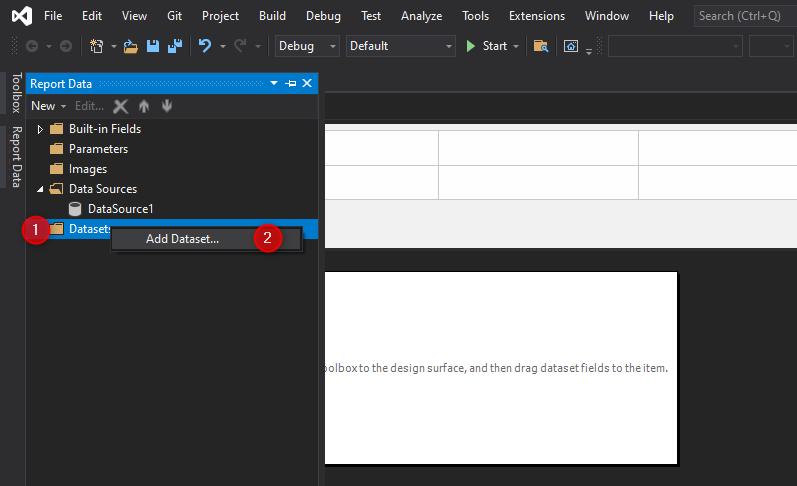
Step 25:- Follow the Below Step
(1) Set or edit Dataset name.
(2) Select Use a dataset embedded in my report Option.
(3) Click on dropdown select Data Source name.
(4) Select Query Type as Stored Procedure.
(5) Select Stored Procedure Name.
(6) Click on Ok button.

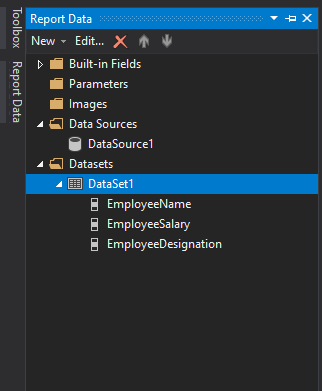
Step 26:- After Adding Dataset Open Report Data & Check Dataset Add Or not in dataset folder.
Step 27:- If you want to add More then one calculated field then right click on dataset & Add Calculated Field. else follow step 28.
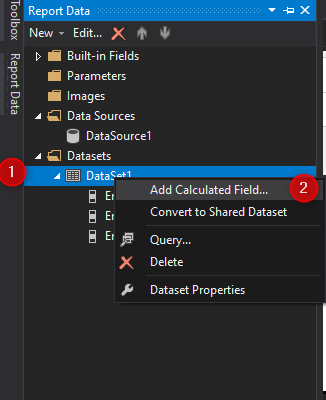
Step 28:- Add calculated field & click on Ok button.

Step 28:- Open Solution Explorer => Reports =>Employees_Details_Reports.rdl.

Step 29:- After Open Employees_Details_Reports.rdl & right click on rdl select Insert option & also select Chart.

Step 30:- Select Chart and click on Ok button.
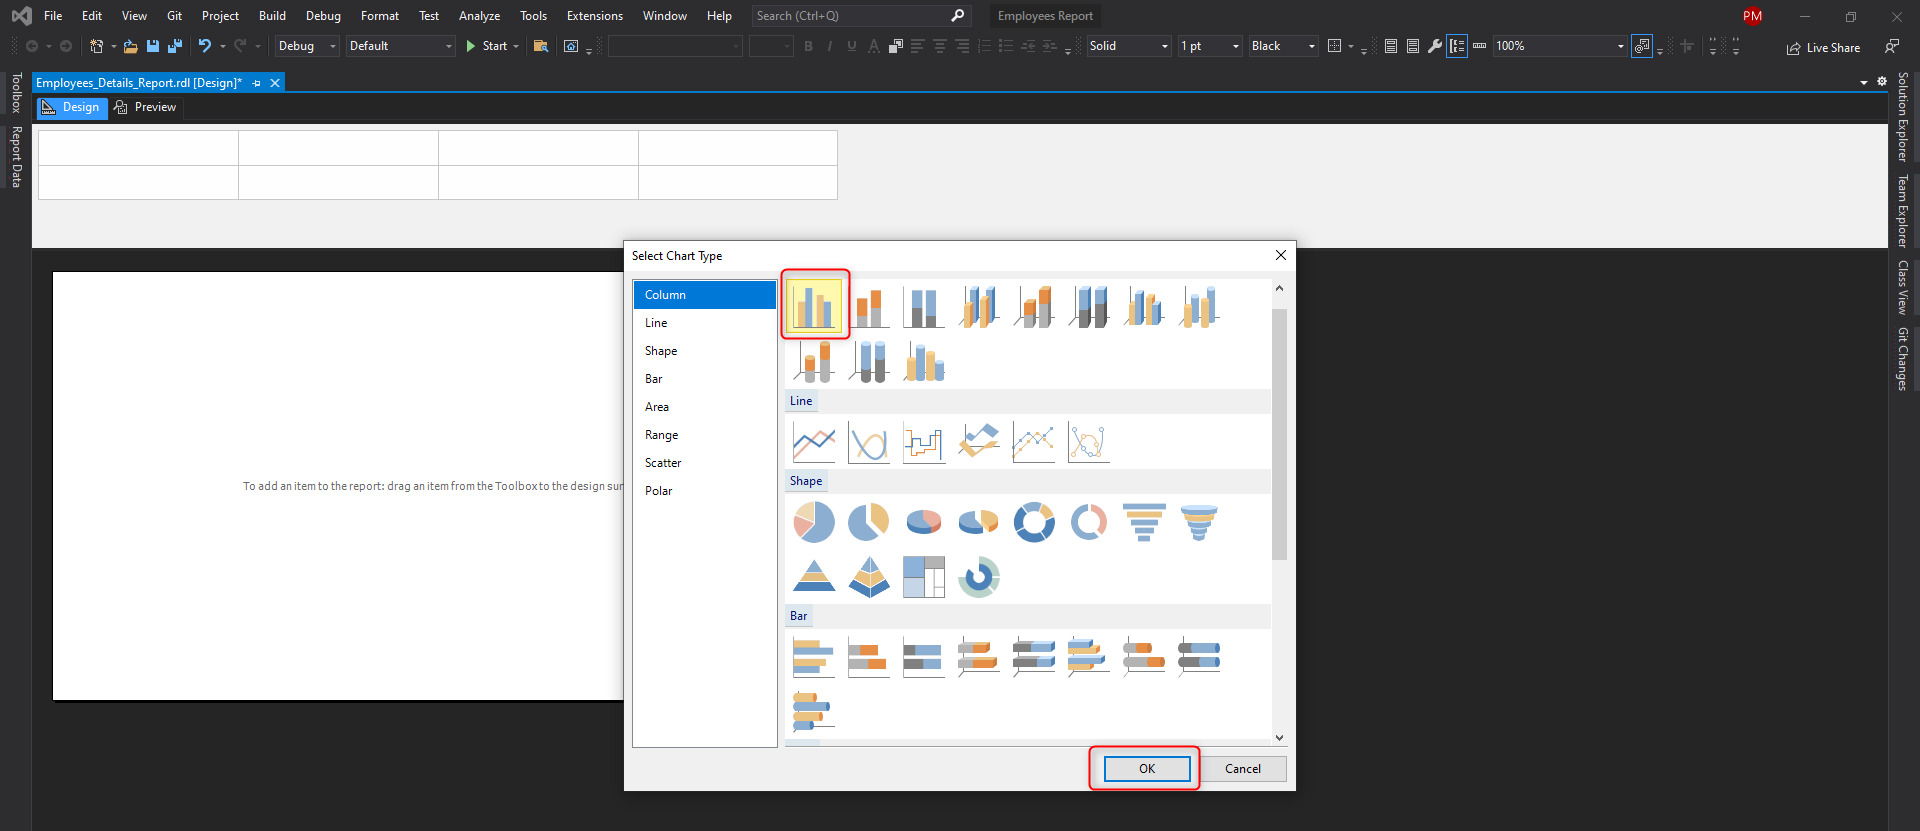
Step 31:- After select chart you see chart like this.
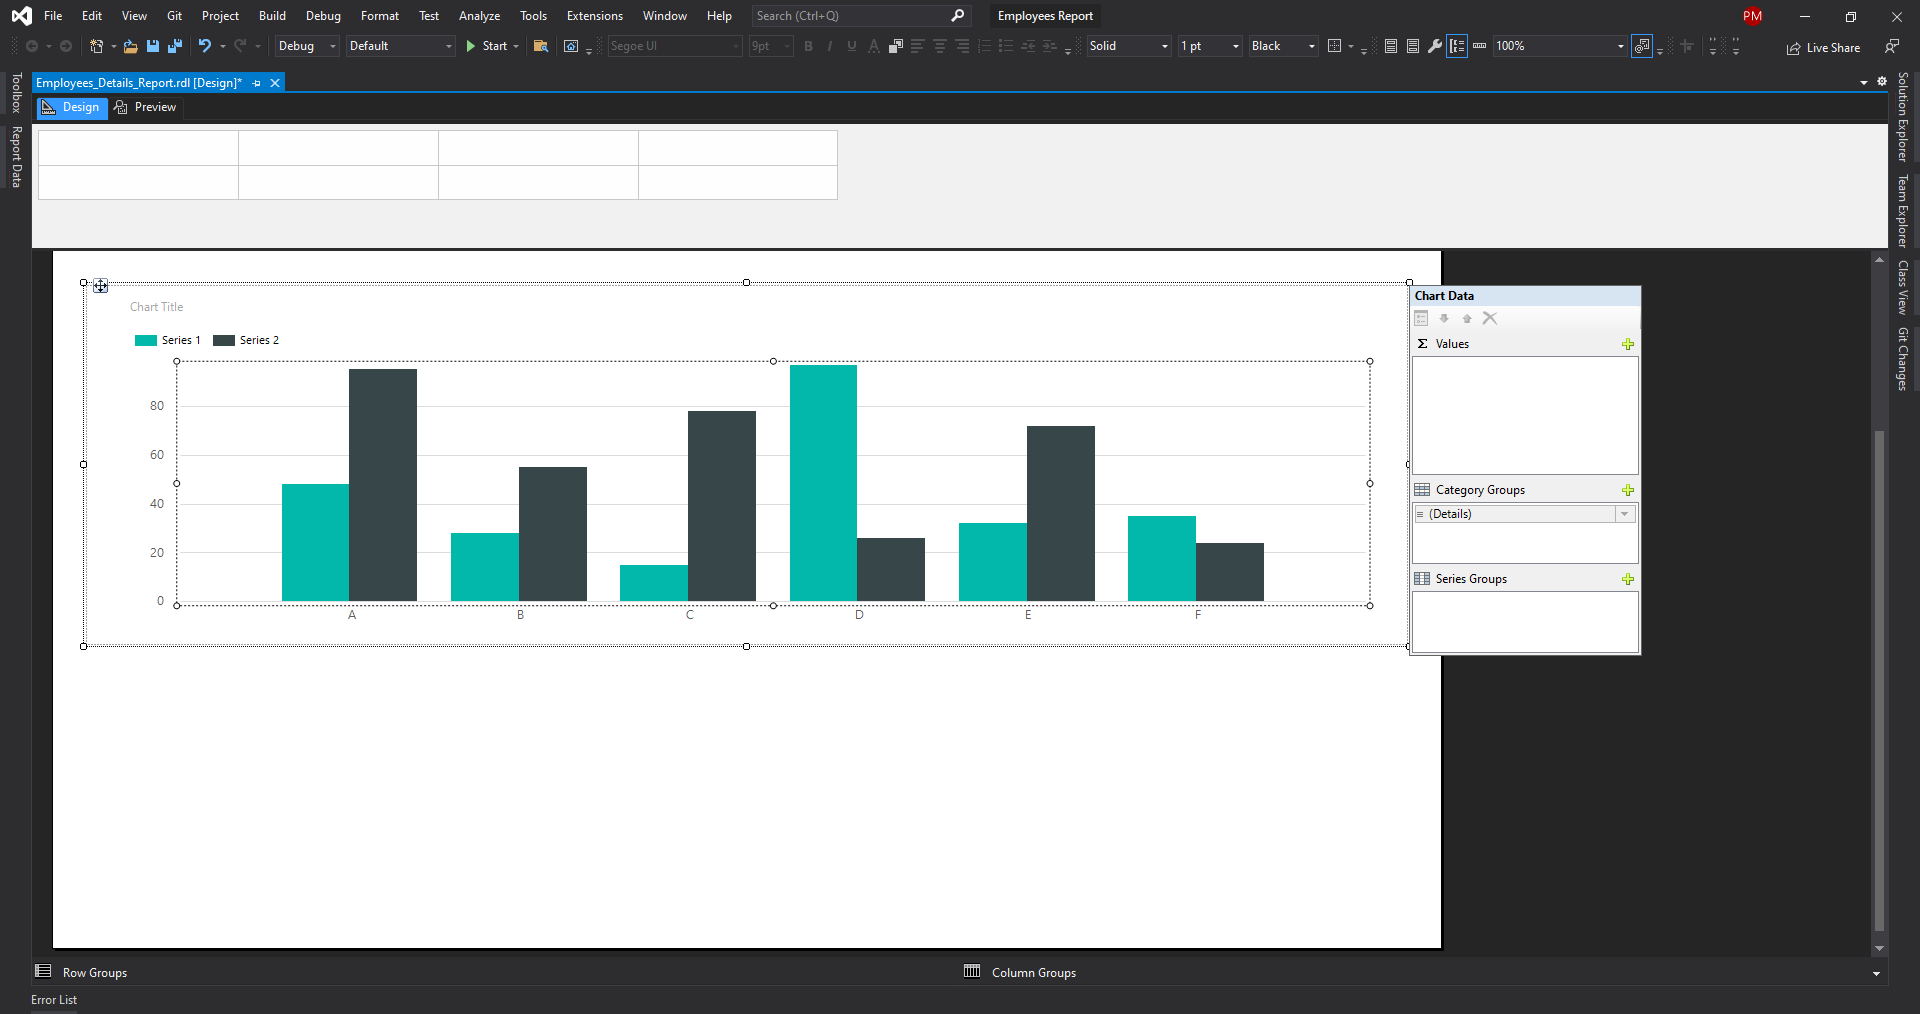
Step 32:- Right click on chart select Value click on Plus (+) button & also select Employees_Salary.
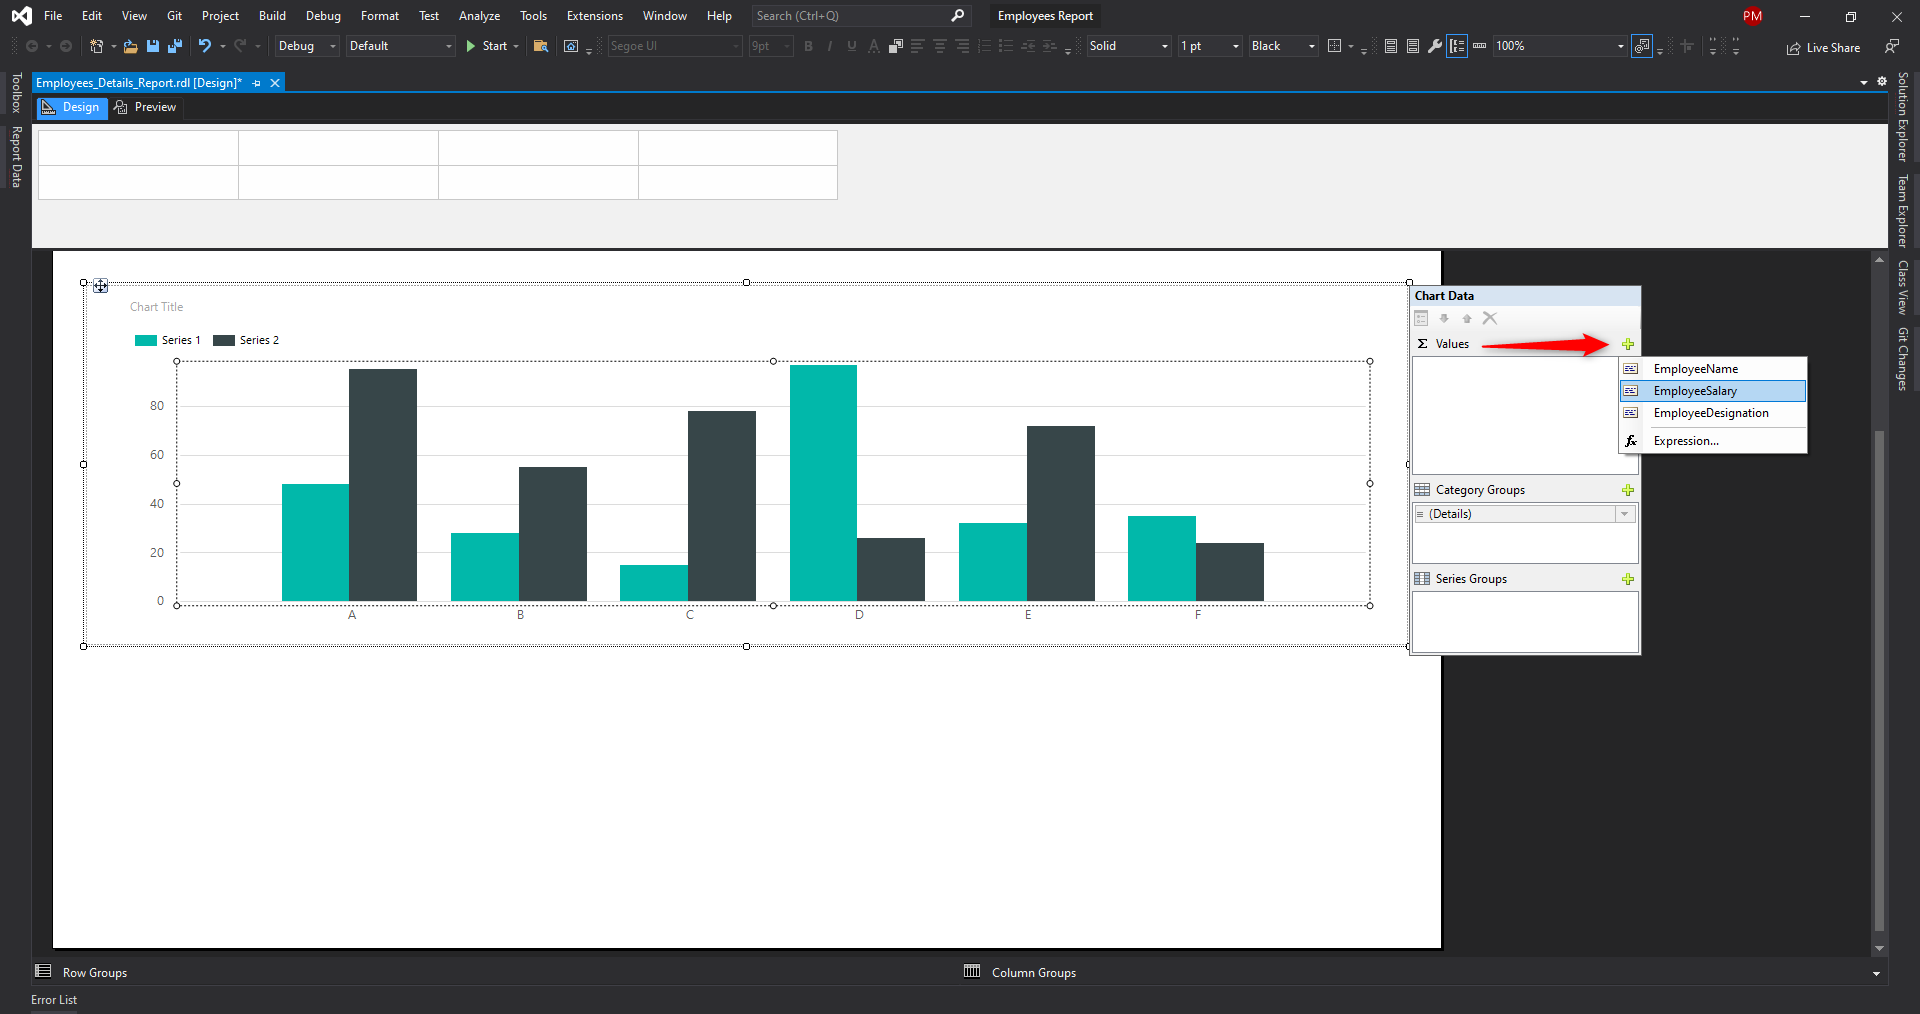
Step 33:- After Select Employees_Salary Chart look like this.
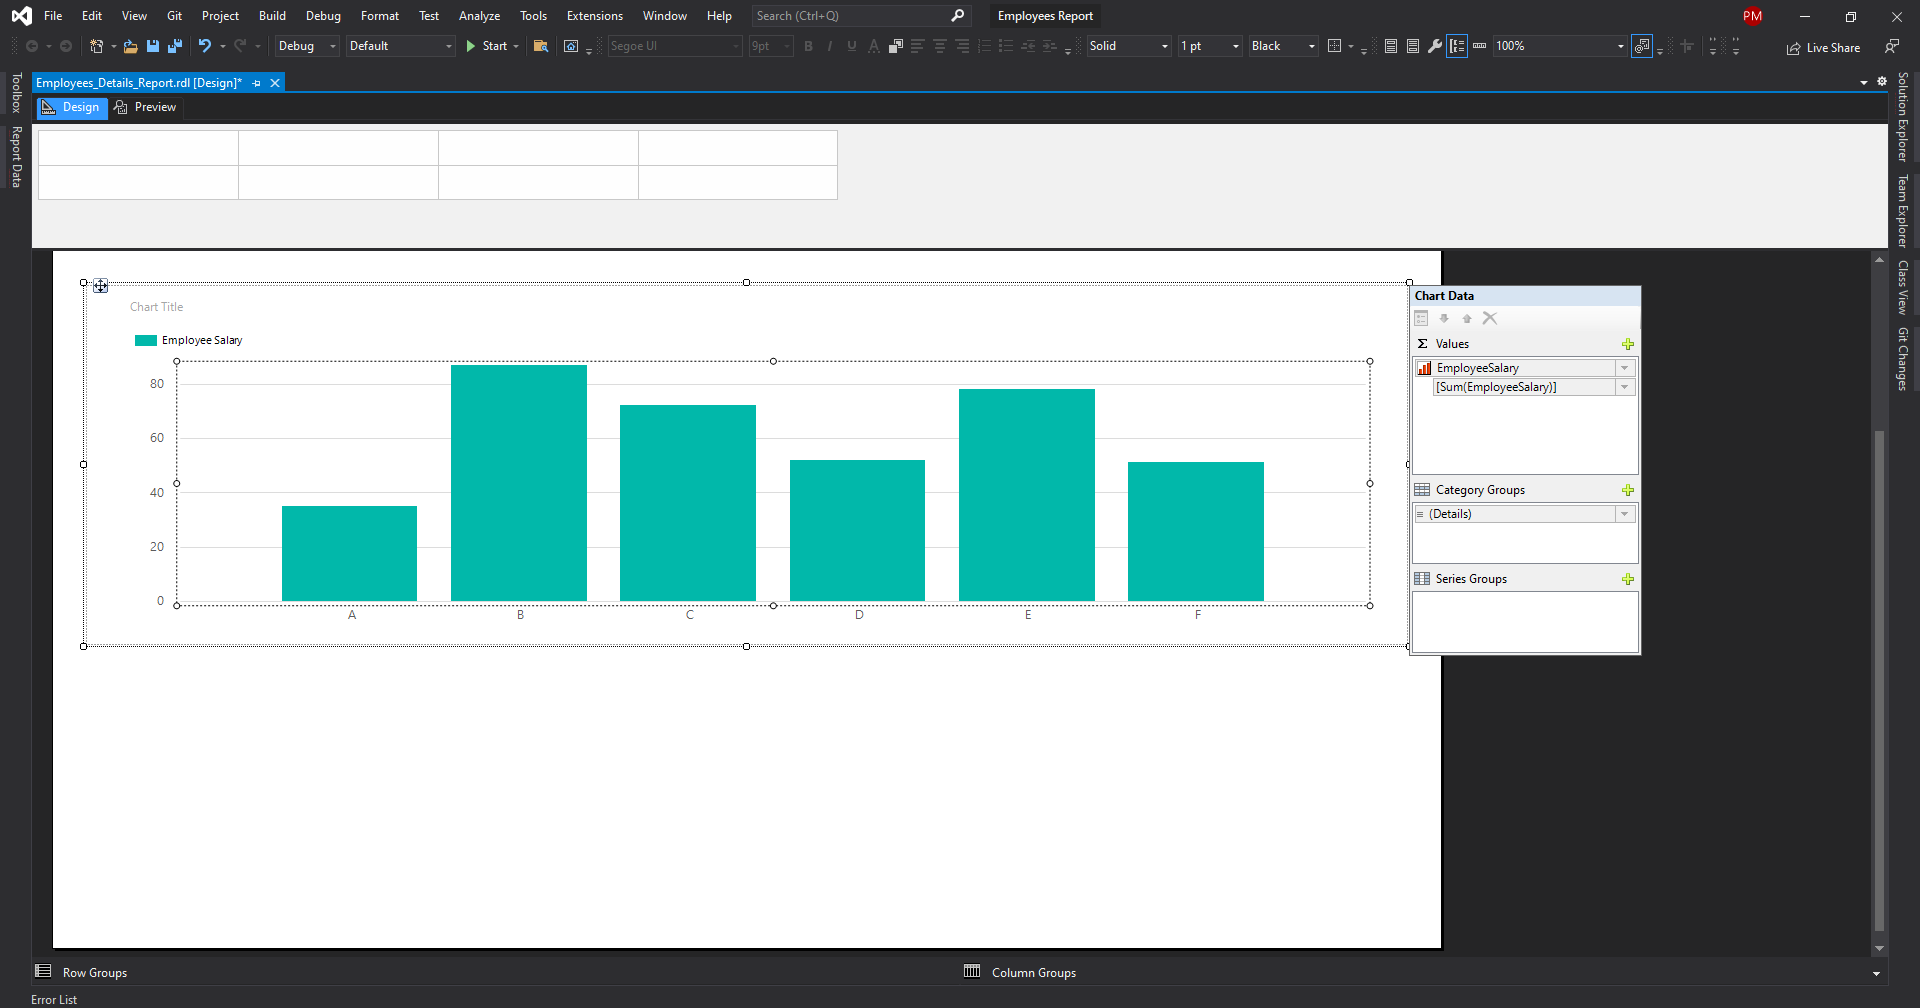
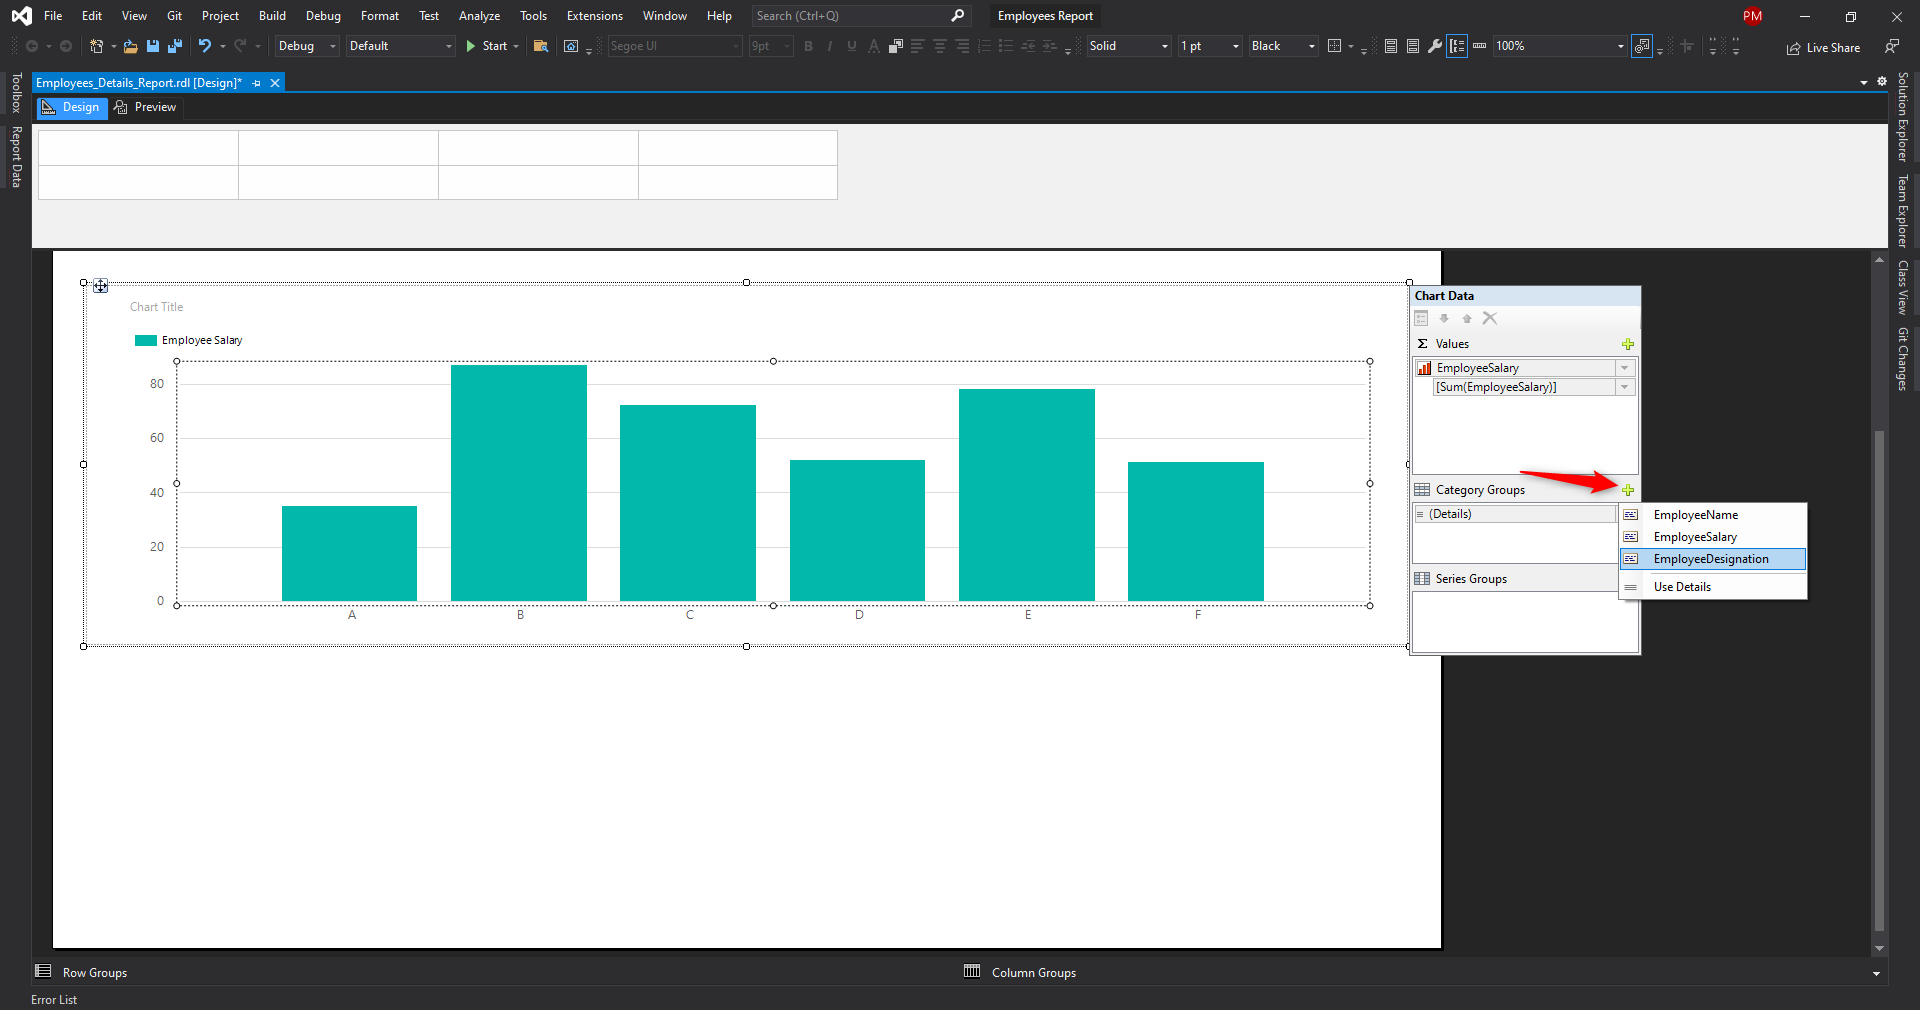
Step 34:- Click on Plus(+) button & also select EmployeeDesignation.
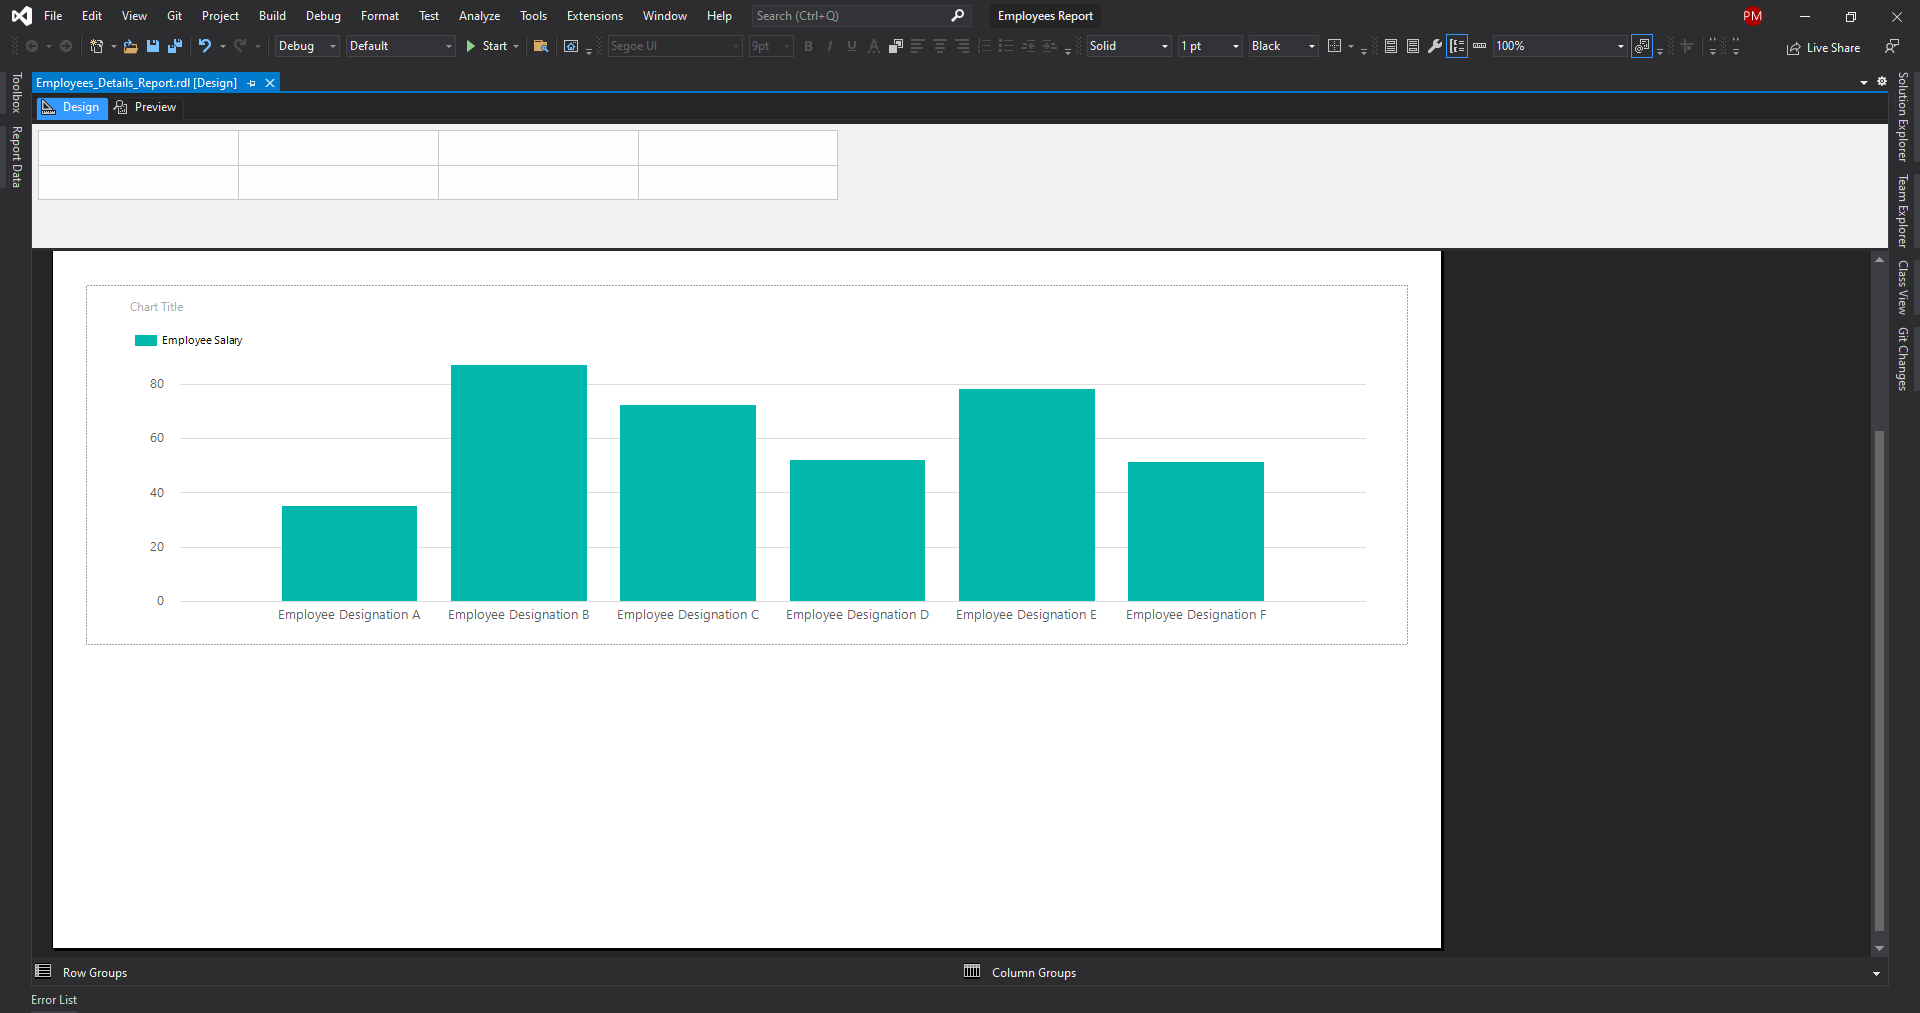
Step 35:- After Select EmployeeDesignation Chart look like this.
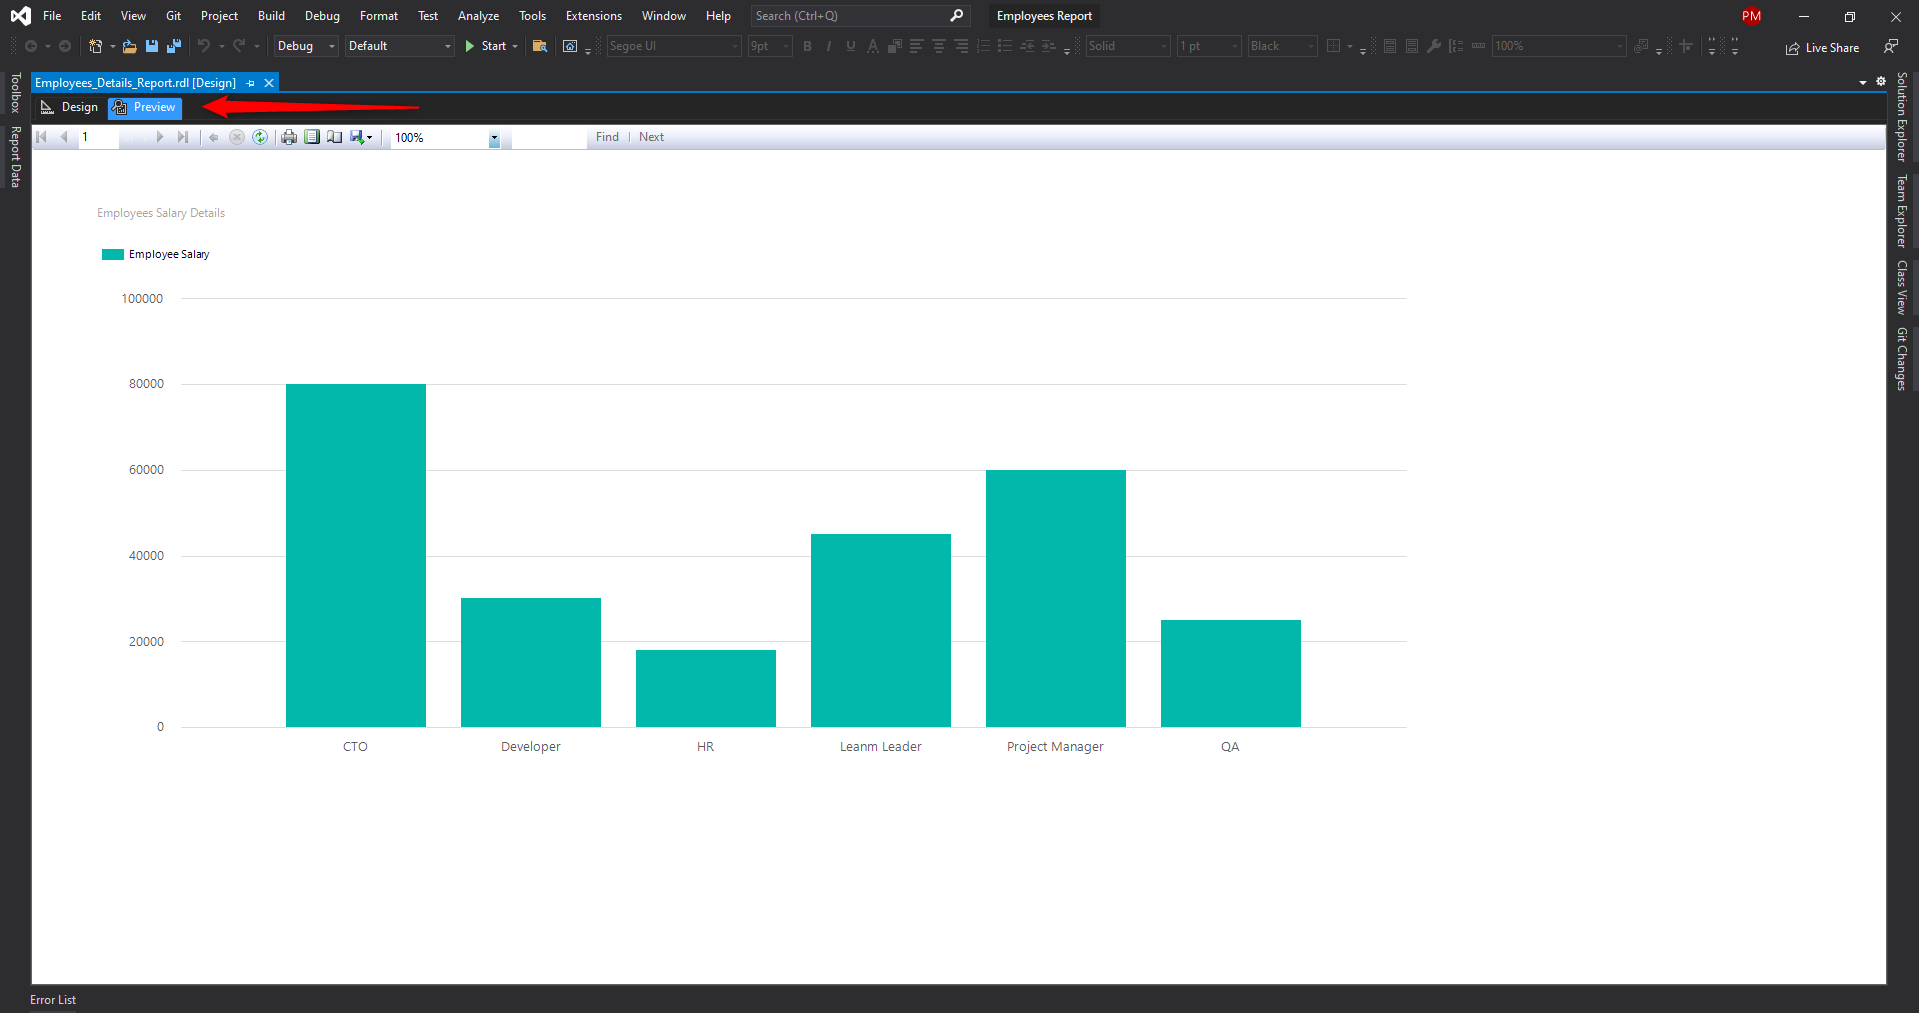
Step 36:- After Click on Preview Mode to see the out put as Employees Salary Wise Graph.
Please give your valuable feedback and if you have any questions or issues about this article, please let me know.
Also Check How To Covert PDF TO HTML Using MVC


