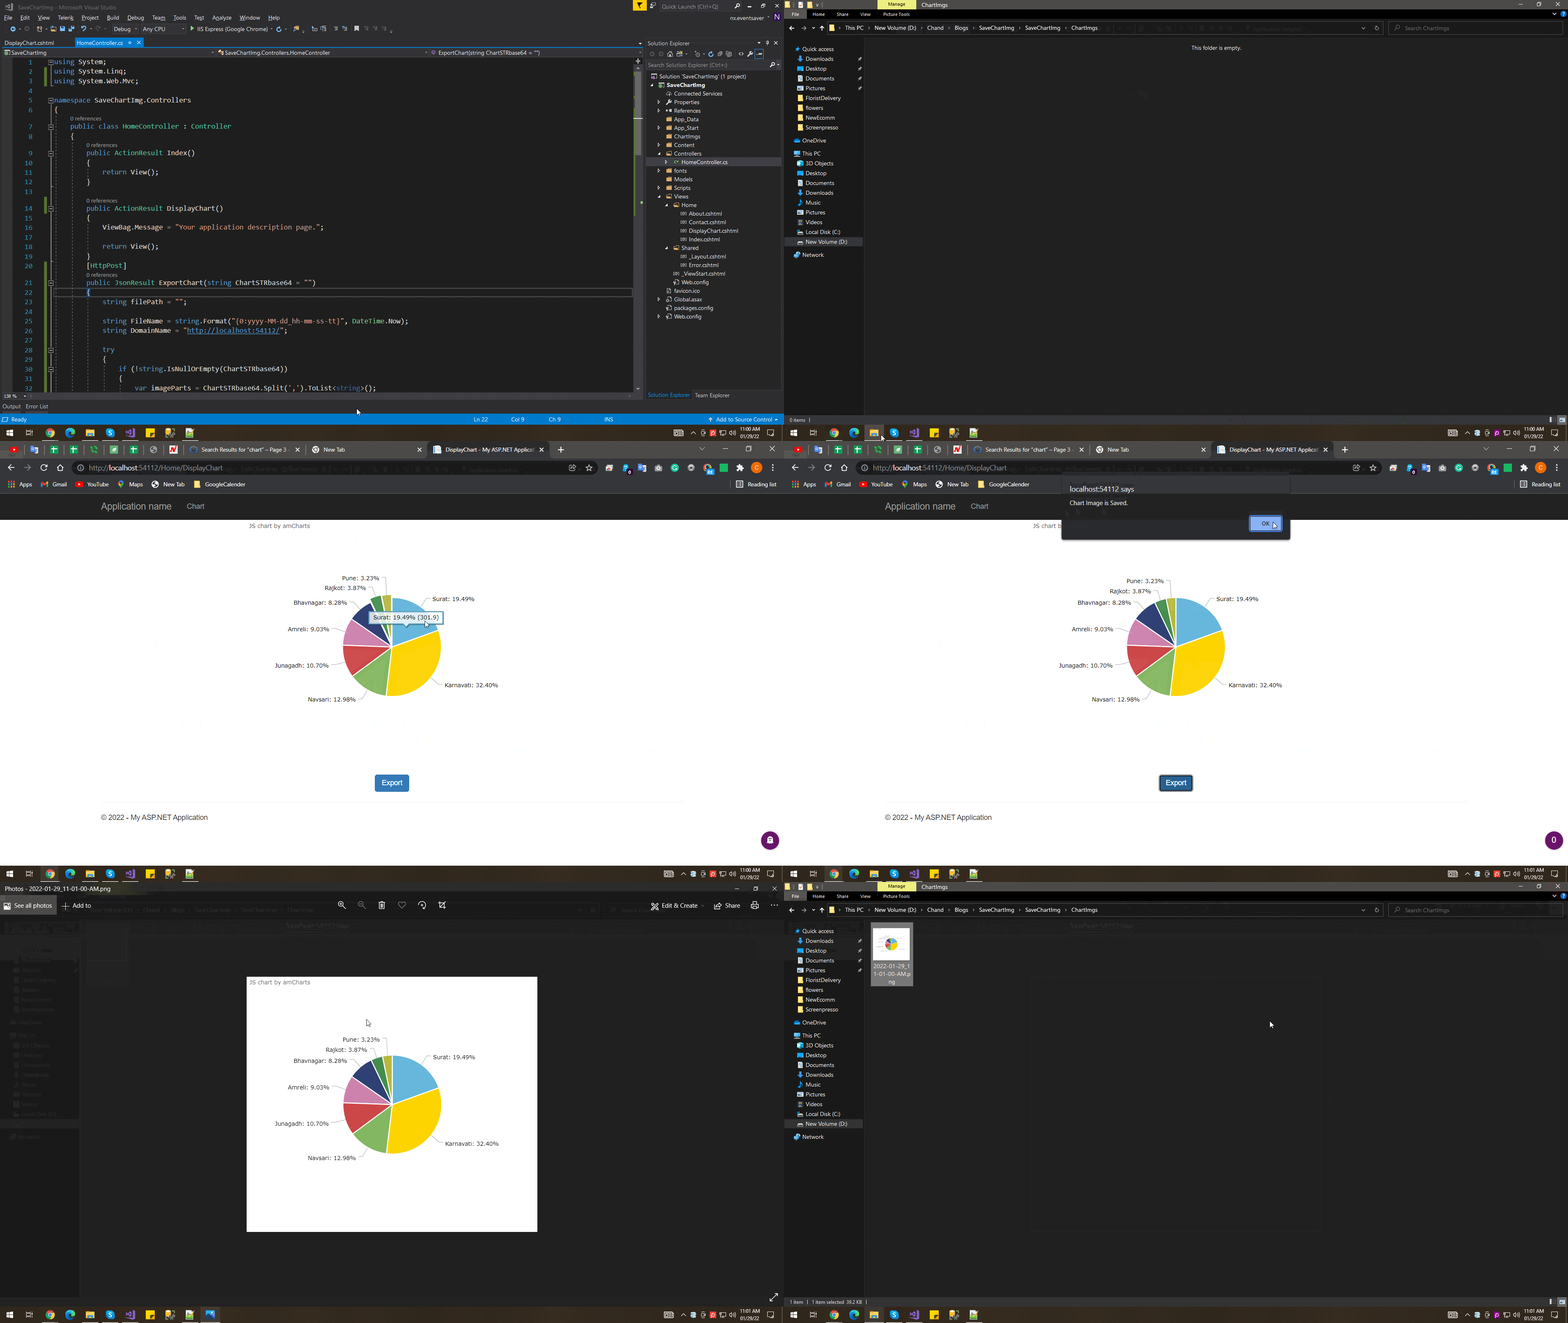
In this article, I will explain how to export chart images to the server in .NET MVC using C# code. So let’s start it.
First of all, create one MVC web application and add the below code to your project.
View Code
@{
    ViewBag.Title = "DisplayChart";
}

<link rel="stylesheet" href="https://www.amcharts.com/lib/3/plugins/export/export.css" type="text/css" media="all" />
<style>
    #Chart {
        width: 100%;
        height: 500px;
        margin: 0 auto;
    }
</style>
<div id="Chart" style="width:50%"></div>
<div class="text-center">
    <input type="button" class="btn btn-primary" id="SaveChart" value="Export" onclick="exportChart();" />
</div>

@section scripts{
    <script src="https://www.amcharts.com/lib/3/amcharts.js"></script>
    <script src="https://www.amcharts.com/lib/3/pie.js"></script>
    <script src="https://www.amcharts.com/lib/3/plugins/export/export.min.js"></script>
    <script src="https://www.amcharts.com/lib/3/themes/light.js"></script>

    <script>
        var chart = "";
        $(document).ready(function () {
            chart = AmCharts.makeChart("Chart", {
                "type": "pie",
                "theme": "light",
                "dataProvider": [{
                    "City": "Surat",
                    "litres": 301.9
                }, {
                    "City": "Karnavati",
                    "litres": 501.9
                }, {
                    "City": "Navsari",
                    "litres": 201.1
                }, {
                    "City": "Junagadh",
                    "litres": 165.8
                }, {
                    "City": "Amreli",
                    "litres": 139.9
                }, {
                    "City": "Bhavnagar",
                    "litres": 128.3
                }, {
                    "City": "Rajkot",
                    "litres": 60
                }, {
                    "City": "Pune",
                    "litres": 50
                }],
                "valueField": "litres",
                "titleField": "City",
                "balloon": {
                    "fixedPosition": true
                },
                "export": {
                    "enabled": true,
                    "menu": []
                }
            });
        });
        function exportChart() {
            debugger
            if (chart != null && chart != "" && chart != 'undefine') {
                chart["export"].capture({}, function () {

                    this.toPNG({}, function (base64) {

                        $.ajax({
                            url: '/Home/ExportChart',
                            type: 'POST',
                            data: { ChartSTRbase64: base64 },
                            success: function (data) {
                                if (data != "") {
                                    alert("Chart Image is Saved.");
                                }
                                else {
                                    alert("Something Went Wrong.");
                                }
                            },
                            error: function (r, s, e) {
                                alert("Something Went Wrong:" + e);
                            }
                        });

                    });
                });
            }
            else {
                alert("Something Went Wrong.");
            }
        }
    </script>
}
In the view, I have added appropriate js and CSS libraries for the chart, necessary js to initialize the chart, and one ajax call to handle an export event.
C# Code
public ActionResult DisplayChart()
        {
            return View();
        }
        [HttpPost]
        public JsonResult ExportChart(string ChartSTRbase64 = "")
        {
            string filePath = "";

            string FileName = string.Format("{0:yyyy-MM-dd_hh-mm-ss-tt}", DateTime.Now);
            string DomainName = "ADD_YOUR_DOMAIN_HERE";

            try
            {
                if (!string.IsNullOrEmpty(ChartSTRbase64))
                {
                    var imageParts = ChartSTRbase64.Split(',').ToList<string>();

                    byte[] Image = Convert.FromBase64String(imageParts[1]);

                    filePath = System.Web.Hosting.HostingEnvironment.MapPath("~/ChartImgs/" + FileName + ".png");
                    System.IO.File.WriteAllBytes(filePath, Image);
                    filePath = DomainName + "ChartImgs/" + FileName + ".png";
                }
                else
                {
                    filePath = "";
                }

            }
            catch (Exception ex)
            {
                filePath = "";
            }

            return Json(filePath, JsonRequestBehavior.AllowGet);
        }
DisplayChart() is for the chart view and ExportChart() for the export chart image. In ExportChart(), we will get the base64 string as an argument, and later, I’m converting that string into an image and saving them on the server in the ChartImgs folder.
Output


