In this article, we will learn how to use the Server Profiler in SQL Server.
Microsoft SQL Server Profiler is a graphical user interface for tracing, recreating, and troubleshooting problems in MS SQL Server, Microsoft’s relational database management system. We can capture and save data about each event to a table or file to analyze later.
For example, we can monitor a production environment to see which stored procedure is affecting performance.
SQL Server Profiler is used for activities such as:
- To find the cause of the problem, stepping through problem queries.
- Finding and diagnosing slow-running queries.
- Capturing the series of Transact-SQL statements that lead to a problem.
- To tune workloads, monitoring the performance of SQL Server.
- Correlating performance counters to diagnose problems.
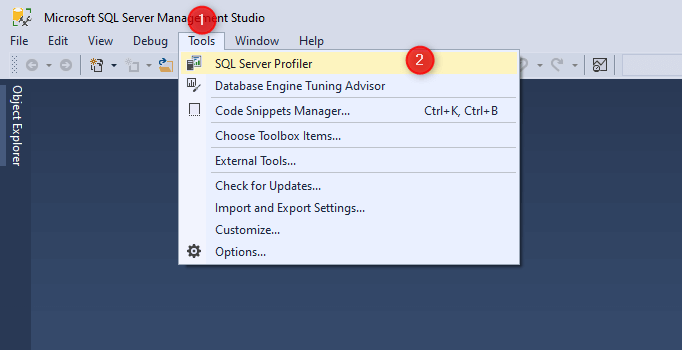
You can start the SQL Profiler from within SQL Server Management Studio, click on Tools menu -> SQL Server Profiler.

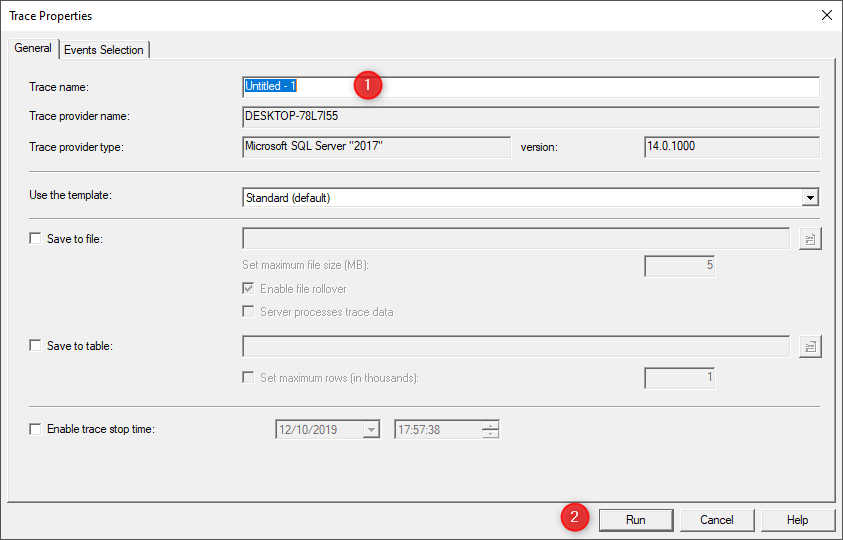
Set Trace Name and click Run.

Now we can trace or monitor SQL results.
Also, check How To Use Date Formats In SQL


Wow, wonderful blog layout! How long have you been blogging for?
you make blogging look easy. The overall look of your site is fantastic, let alone the content!
I like what you guys are up also. Such clever work and reporting! Keep up the excellent works guys I have incorporated you guys to my blogroll. I think it will improve the value of my web site 🙂
I am very happy to read this. This is the type of manual that needs to be given and not the accidental misinformation that’s at the other blogs. Appreciate your sharing this greatest doc.
Thank You 🙂